Rising Phoenix is dedicated to providing transparent, best practices to bring our clients the best possible results. We allow people that are searching for our clients product or service to find them. We use a syndication strategy that brings customers streaming through the door. This content syndication strategy provides a multi-faceted approach to traffic that brings in customers from multiple channels.
http://www.risingphoenixseo.com
Publishing original content to your website is, of course, critical for building your audience and boosting your SEO.
The benefits of unique and original content are twofold:
Original content delivers a superior user experience.
Original content helps ensure that search engines aren’t forced to choose between multiple pages of yours that have the same content.
However, when content is duplicated either accidentally or on purpose, search engines will not be duped and may penalize a site with lower search rankings accordingly. Unfortunately, many businesses often publish repeated content without being aware that they’re doing so. This is why auditing your site with a duplicate content checker is so valuable in helping sites to recognize and replace such content as necessary.
This article will help you better understand what is considered duplicate content, and steps you can take to make sure it doesn’t hamper your SEO efforts.
How does Google define “duplicate content”?
Duplicate content is described by Google as content “within or across domains that either completely matches other content or are appreciably similar”. Content fitting this description can be repeated either on more than one page within your site, or across different websites. Common places where this duplicate content might be hiding include duplicated copy across landing pages or blog posts, or harder-to-detect areas such as meta descriptions that are repeated in a webpage’s code. Duplicate content can be produced erroneously in a number of ways, from simply reposting existing content by mistake to allowing the same page content to be accessible via multiple URLs.
When visitors come to your page and begin reading what seems to be newly posted content only to realize they’ve read it before, that experience can reduce their trust in your site and likeliness that they’ll seek out your content in the future. Search engines have an equally confusing experience when faced with multiple pages with similar or identical content and often respond to the challenge by assigning lower search rankings across the board.
At the same time, there are sites that intentionally duplicate content for malicious purposes, scraping content from other sites that don’t belong to them or duplicating content known to deliver successful SEO in an attempt to game search engine algorithms. However, most commonly, duplicated content is simply published by mistake. There are also scenarios where republishing existing content is acceptable, such as guest blogs, syndicated content, intentional variations on the copy, and more. These techniques should only be used in tandem with best practices that help search engines understand that this content is being republished on purpose (described below).
Source: Alexa.com SEO Audit
An automated duplicate content checker tool can quickly and easily help you determine where such content exists on your site, even if hidden in the site code. Such tools should display each URL and meta description containing duplicate content so that you can methodically perform the work of addressing these issues. While the most obvious practice is to either remove repeated content or add original copy as a replacement, there are several other approaches you might find valuable.
These tags can tell search engines which specific URL should be viewed as the master copy of a page, thus solving any duplicate content confusion from the search engines’ standpoint.
2. Using 301 redirects
These offer a simple and search engine-friendly method of sending visitors to the correct URL when a duplicate page needs to be removed.
3. Using the “noindex” meta tags
These will simply tell search engines not to index pages, which can be advantageous in certain circumstances.
This tool helps you tell Google not to crawl pages with specific parameters. This might be a good solution if your site uses parameters as a way to deliver content to the visitor that is mostly the same content with minor changes (i.e. headline changes, color changes, etc). This tool makes it simple to let Google know that your duplicated content is intentional and should not be considered for SEO purposes.
Source: Alexa.com SEO Audit
By actively checking your site for duplicated content and addressing any issues satisfactorily, you can improve not only the search rankings of your site’s pages but also make sure that your site visitors are directed to fresh content that keeps them coming back for more.
Got any effective tips of how you deal with on-site content duplication? Share them in the comments.
Venngage is a free infographic maker that has catered to more than 21,000 businesses. In this article, we explore how they grew their organic traffic from about 275,000 visitors per month in November 2017 to about 900,000 today — more than tripling in 17 months.
I spoke with Nadya Khoja, Chief Growth Officer at Venngage, about their process.
Venngage gets most of their leads from content and organic search. The percentage varies from month to month in the range of 58% to 65%.
In Nov 2017, Venngage enjoyed 275,000 visitors a month from organic search traffic. Today (16 months later) it’s 900,000. Nadya Khoja (their Chief Growth Officer) extrapolated from their current trend that by December of 2019 (in nine months) they will enjoy three million organic search visitors per month.
In 2015, when Nadya started with Venngage, they saw 300 to 400 registrations a week. By March of 2018, this was up to 25,000 a week. Today it’s 45,000.
While Nadya had the advantage of not starting from zero, that is impressive growth per any reasonable metric. How did they do it?
Recipe
There are a lot of pieces to this puzzle. I’ll do my best to explain them, and how they tie together. There is no correct order to things per se, so what is below is my perspective on how best to tell this story.
The single most important ingredient: Hypothesize, test, analyze, adjust
This critical ingredient is surprisingly not an ingredient, but rather a methodology. I’m tempted to call it “the scientific method”, as that’s an accurate description, but perhaps it’s more accurate to call it the methodology written up in the books “The Lean Startup” (which Nadya has read) and “Running Lean” (which Nadya has not read).
This single most important ingredient is the methodology of the hypothesize, test, analyze, and adjust.
What got them to this methodology was a desire to de-risk SEO.
The growth in traffic and leads was managed through a series of small and quick iterations, each one of which either passed or failed. Ones that passed were done more. Ones that failed were abandoned.
This concept of hypothesizing, testing, analyzing, and adjusting is used both for SEO changes and for changes to their products.
The second most important ingredient
This ingredient is shared knowledge. Venngage marketing developed “The Playbook”, which everyone in marketing contributes to. “The Playbook” was created both as a reference with which to bring new team members up to speed quickly, as well as a running history of what has been tested and how it went.
The importance of these first two ingredients cannot be overstated. From here on, I am revealing things they learned through trial and error. You have the advantage to learn from their successes and failures. They figured this stuff out the hard way. One hypothesis and one test at a time.
Their north star metrics
They have two north star metrics. The first one seems fairly obvious. “How many infographics are completed within a given time period?” The second one occurred to them later and is as important, if not more so. It is “how long does it take to complete an infographic?”
The first metric, of course, tells them how attractive their product is. The second tells them how easy (or hard) their product is to use.
Together these are the primary metrics that drive everything Venngage does.
The 50/50 focus split
As a result of both the company and the marketing department having a focus on customer acquisition and customer retention, every person in marketing spends half their time working on improving the first north star metric, and the other half spend their time working on improving the second.
Marketing driving product design
Those north star metrics have led to Venngage developing what I call marketing driven product design. Everywhere I ever worked has claimed they did this. The way Venngage does this exceeds anything ever done at a company I’ve worked for.
“How do I be good?”
This part of Nadya’s story reminds me of the start of a promo video I once saw for MasterClass.com. It’s such a good segue to this part of the story that I cropped out all but the good part to include in this article.
When Steve Martin shed light on an important marketing question
I’ve encountered a number of companiesthrough the years who thought of marketing as “generating leads” and “selling it”, rather than “how do we learn what our customers want?”, or “how do we make our product easier to use?”
Squads
The company is structured into cross-functional squads, a cross-functional squad being people from various departments within Venngage, all working to improve a company-wide metric.
For example, one of the aspects of their infographic product is templates. A template is a starting point for building an infographic.
As templates are their largest customer acquisition channel, they created a “Template Squad”, whose job is to work on their two north star metrics for their templates.
The squad consists of developers, designers, UI/UX people, and the squad leader, who is someone in marketing. Personally, I love this marketing focus, as it de-focuses marketing and causes marketing to be something that permeates everything the company does.
There is another squad devoted to internationalization, which as you can infer, is responsible to improve their two north star metrics with users in countries around the world.
Iterative development
Each template squad member is tasked with improving their two north star metrics.
Ideas on how to do this come from squad members with various backgrounds and ideas.
Each idea is translated into a testable hypothesis. Modifications are done weekly. As you can image, Venngage is heavy into analytics, as without detailed and sophisticated analytics, they don’t know which experiments worked and which didn’t.
Examples of ideas that worked are:
Break up the templates page into a series of pages, which contain either category of templates or single templates.
Ensure each template page contains SEO keywords specific for the appropriate industry or audience segment. This is described in more detail further in this document.
Undo the forced backlink each of the embedded templates used to contain.
This allowed them to get initial traction, but it later resulted in a Google penalty.
This is a prime example of an SEO tactic that worked until it didn’t.
Create an SEO checklist for all template pages with a focus on technical SEO.
This eliminated human error from the process.
Eliminate “React headers” Google was not indexing.
Determine what infographic templates and features people don’t use and eliminate them.
Measuring inputs
I personally think this is really important. To obtain outputs, they measured inputs. When the goal was to increase registrations, they identified the things they had to do to increase registrations, then measured how much of that they did every week.
Everyone does SEO
In the same way that marketing is something that does not stand alone, but rather permeates everything Venngage does, SEO does not stand alone. It permeates everything marketing does. Since organic search traffic is the number one source of leads, they ensure everyone in marketing knows the basics of technical SEO and understands the importance of this never being neglected.
Beliefs and values
While I understand the importance of beliefs and values in human psychology, it was refreshing to see this being proactively addressed within an organization in the context of improving their north star metrics.
They win and lose together
Winning and losing together is a core belief at Venngage. Nadya states it minimizes blame and finger-pointing. When they win, they all win. When they lose, they all lose. It doesn’t matter who played what part. To use a sports analogy, a good assist helps to score a goal. A bad assist, well, that’s an opportunity to learn.
SEO is a team effort
While it is technically possible for a single person to do SEO, the volume of tasks required these days makes it impractical. SEO requires quality content, technical SEO, and building of backlinks through content promotion, guest posting, and the others. Venngage is a great example of effectively distributing SEO responsibilities through the marketing department.
To illustrate the importance of the various pieces fitting together, consider that while content is king, technical SEO is what gets content found, but when people find crappy content, it doesn’t convert.
You can’t manage what you don’t measure
This requires no elaboration.
But what you measure matters
This probably does justify some elaboration. We’ve all been in organizations that measured stupid stuff. By narrowing down to their two north star metrics, then focusing their efforts to improving those metrics, they’ve aligned everyone’s activity towards things that matter.
Venngage developed their second north star metric after deciding that acquiring new customers was not, in and of itself, any form of the Holy Grail. They realized that if their product was hard to use, fewer people would use it.
They decided a good general metric of how easy the product is to use was to measure how long people take to build an infographic. If people took “too long”, they spoke to them about why.
This led them to change the product in ways to make it easier to use.
Link building is relationship building
As a reader of Search Engine Watch, you know link building is critical and central to SEO. In the same way that everyone in Venngage marketing must know the basics of technical SEO, everyone in Venngage marketing must build links.
They do so via outreach to promote their content. As people earn links from the content promotion outreach, they record those links in a shared spreadsheet.
While this next bit is related to link building, everyone in Venngage marketing has traffic goals as well.
This too is tracked in a simple and reasonable way. Various marketers own different “areas” or “channels”. These channels are broken down into specific traffic acquisition metrics.
As new hires get more familiar with how things work at Venngage, they are guided into traffic acquisition channels which they want to work on.
Learning experience, over time
My attempt here is to provide a chronology of what they learned in what order. It may help you avoid some of the mistakes they made.
Cheating works until it doesn’t
Understanding the importance of links to search ranking, they thought it would be a good idea to implement their infographics with embedded backlinks. Each implemented infographic contained a forced backlink to the Venngage website.
They identified a set of anchor text they thought would be beneficial to them and rotated through them for these forced backlinks.
And it worked, for a while. Until they realized they had invited a Google penalty. This took a bit to clean up.
The lessons learned:
The quality of your backlinks matter.
To attract quality backlinks, publish quality content.
Blog posts brought in users who activated
At some point, their analytics helped them realize that users who activated from blog posts where ideal users for them. So they set a goal to increase activations from blog posts, which led to the decision to test if breaking up templates into categories and individual pages with only one template made sense. It did.
Website design matters
Changing the website from one big template page to thousands of smaller ones helped, and not just because it greatly increased the number of URLs indexed by Google. It also greatly improved the user experience. It made it easier for their audience to find templates relevant to them, without having to look at templates that weren’t.
Lesson learned: UI/UX matters for both users and SEO.
Hybrid content attracts
Hybrid content is where an article talks about two main things. For example, talking about Hogwarts houses sorting within the context of an infographic. This type of content brings in some number of Harry Potter fans, some of whom have an interest in creating infographics. The key to success is tying these two different topics together well.
Content is tuneable
By converting one huge templates page into thousands of small template pages, they realized that a template or set of templates that appeal to one audience segment would not necessarily appeal to others. This caused them to start to tune templates towards audience segments in pursuit of more long tail organic search traffic.
How did they figure out what users wanted in terms of better content? They used a combination of keyword research and talking with users and prospects.
Some content doesn’t make the cut
After they caught onto the benefits of tuning content to attract different audience segments, they looked for content on their site that no one seemed to care about. They deleted it. While it decreased the amount of content on their site, it increased their overall content quality.
Traffic spikes are not always good news
When they initially started creating forced backlinks in their infographics, they could see their traffic increase. They saw some spikes. Their general thought was more traffic is good.
When they experienced the Google penalty, they realized how wrong they were. Some traffic spikes are bad news. Others are good news.
When your website traffic shows a sudden change, even if you’re experiencing a spike in organic search traffic, you must dig into the details and find out the root cause.
Lesson learned: There is a thing as bad traffic. Some traffic warns you of a problem.
Links from product embeds aren’t all bad
They just needed to make the embedded links optional. To allow the customer to decide if they do or do not deserve a backlink. While this did not cause any change to their levels of organic search traffic, it was necessary to resolve the Google penalty.
Boring works
Incremental continuous improvement seems repetitive and boring. A one percent tweak here, a two percent tweak there, but over time, you’ve tripled your organic search traffic and your lead flow.
It’s necessarily fun, but it delivers results.
Lesson learned: What I’ll call “infrastructure” is boring, and it matters. Both for your product and your SEO.
Figure out what to measure
The idea of measuring the amount of time required to complete an infographic did not occur to them on day one. This idea came up when they were looking for a metric to indicate to them how easy (or difficult) their product was to use.
Once they decided this metric possibly made sense, they determined their baseline, then through an iterative process, making improvements to the product to make this a little faster.
As they did so, the feedback from the users was positive, so they doubled down on this effort.
Lesson learned: What you measure matters.
Teach your coworkers well
They created “The Playbook”, which is a compendium of the combined knowledge they’ve accumulated over time. The playbook is written by them, for them.
Marketing employees are required to add chapters to the playbook as they learn new skills and methods.
Its primary purpose is to bring new team members up to speed quickly, and it also serves as a historical record of what did and did not work.
One important aspect of continuous improvement is for new people to avoid suggesting experiments that previously failed.
Additionally (and I love this), every month everyone in marketing gives Nadya an outline of what they’re learning and what they’re improving on.
Their marketing stack
While their marketing stack is not essential to understanding their processes, I find it useful to understand what software tools a marketing organization uses, and for what. So here is theirs. This is not a list of what they’ve used and abandoned over time, but rather a list of what they use now.
Analytics: Google Analytics and Mixpanel
Customer communications: Intercom
Link analysis and building: Ahrefs
Link building outreach: Mailshake
Project management: Trello
General purpose: G Suite
In closing
To me, what Nadya has done at Venngage is a case study in how to do SEO right, and most of doing it right are not technical SEO work.
Help senior management understand that some things that are not typically thought of as SEO (website design for example) can have serious SEO implications.
Get senior management buy in to include these non-SEO functions in your SEO efforts.
Understand what very few basic metrics matter for your company, and how you measure them.
Distribute required SEO work through as many people as reasonably possible. Include people whose job functions are not necessarily SEO related (writers, designers, UI/UX, and more).
Test and measure everything.
Win big through a continuous stream of small incremental improvements.
Venngage has surely lead by example and all the guidelines and pointers shared above can surely help your organization implement its search for increased sales.
Kevin Carney is the Founder and CEO of the boutique link building agency Organic Growth.
DuckDuckGo could be your new default search engine if you want to focus on privacy and security. What it’s like using it nowadays?
You might have heard of DuckDuckGo in the past. Our first long post about it was back in 2016 with Rebecca Sentance trying out the new search engine for a week.
Three years later, many things have changed. More users are losing trust in big tech companies and privacy and security are more important than ever. How does DuckDuckGo fit in this change?
And how is the experience of switching into a new search engine nowadays?
DuckDuckGo in numbers
Over the last few months, DuckDuckGo has seen increased media coverage. Its growing stats among a growing conversation around online privacy make it more relevant than ever.
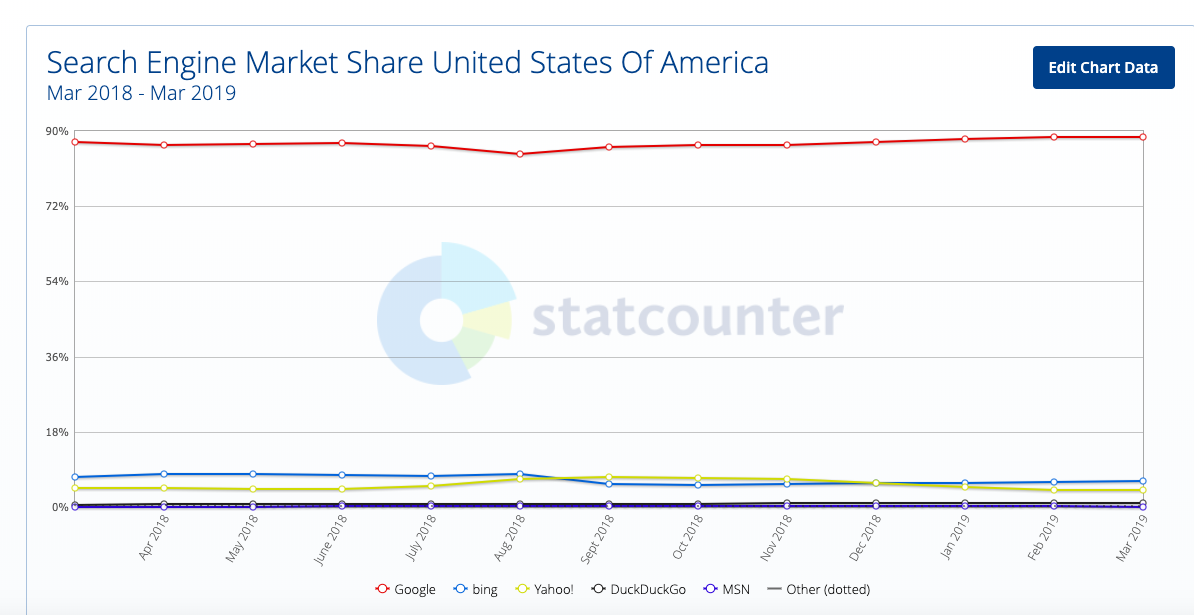
There are more than 30 million searches happening on DuckDuckGo every day. Its data indicates a constant growth. It’s currently the fourth largest search engine in the U.S. counting more than 1 billion searches every month all over the world.
Google is holding the reins of the market share with 88.5% of it, Bing is following with 6.12%, Yahoo! is third with 4.11% and DuckDuckGo is forthwith 0.99% of the market share.
It clearly has a long way to go to stand out as a serious competitor in the market share. However, it has already paved the way in a new kind of search engine that is serious about security and privacy. In fact, its mission is to set a new standard of trust online.
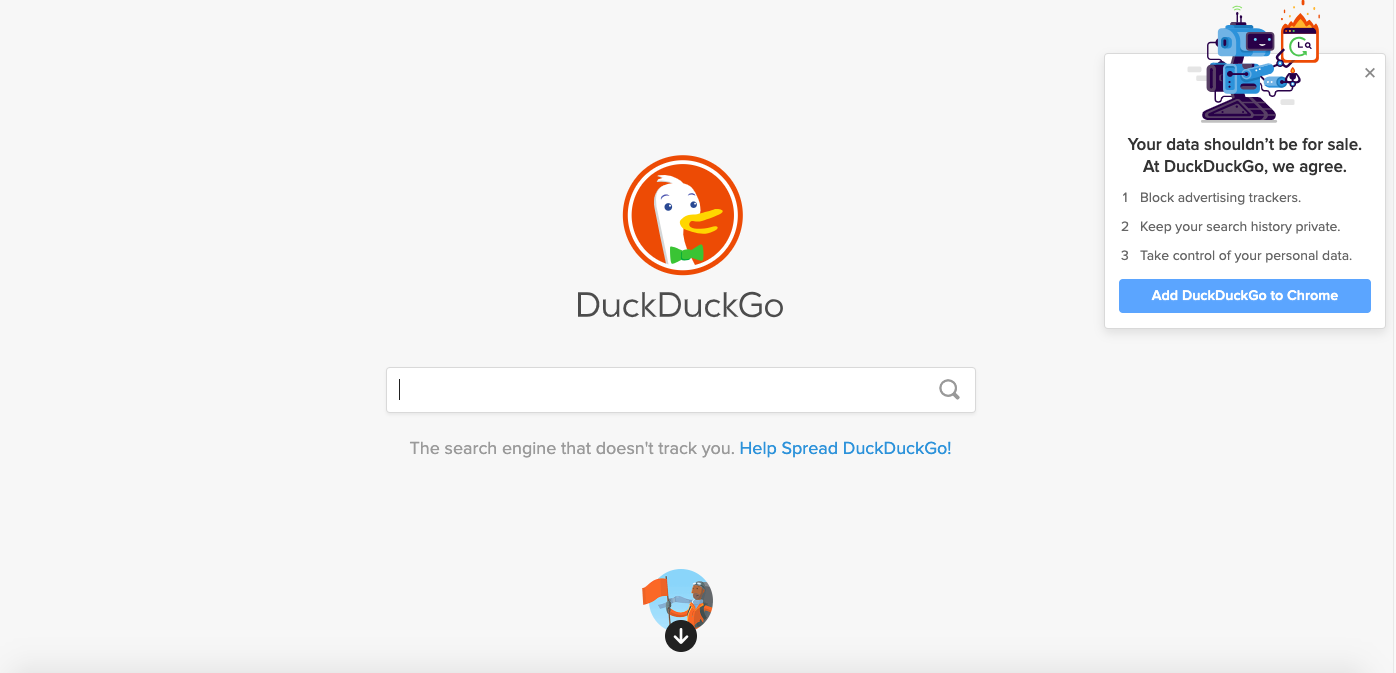
The search engine that doesn’t track you
One of the first things you notice when visiting DuckDuckGo, except for the search box, is the subheading “the search engine that doesn’t track you”.
DuckDuckGo was built as an alternative to Google and the big search engines that use tracking data to improve personalization. DuckDuckGo reassures its users that they don’t store their personal information. They don’t collect or share personal data. They are not storing your search history, which means that they are not able to sell this data to advertisers. Moreover, there’s no tracking in the private browsing mode, which sounds encouraging for everyone who is interested in a search engine that won’t track every single search.
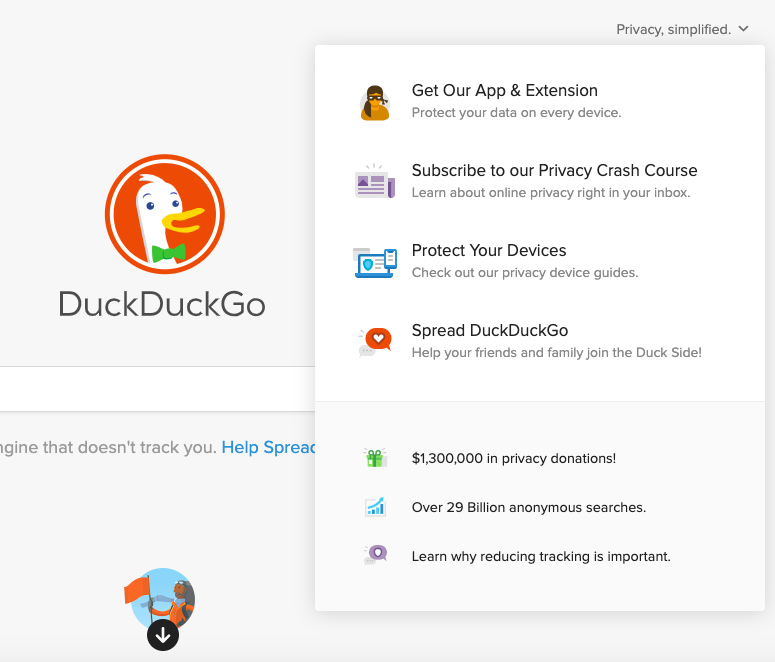
What’s interesting is that DuckDuckGo wants to prove that they take privacy seriously. A click on their menu button at the homepage on ‘privacy simplified’ allows you to:
Protect your data on every device
Subscribe to their Privacy Crash Course to improve your understanding of online privacy
Protect your devices by reading privacy guides
Find out more about the importance of reduced tracking
Just recently, Google announced an expanded number of default search engines for users including DuckDuckGo for the first time. This was certainly a small win for the DuckDuckGo and also for people who want to focus on private searches.
It’s not surprising that more users are interested in learning more about their online privacy.
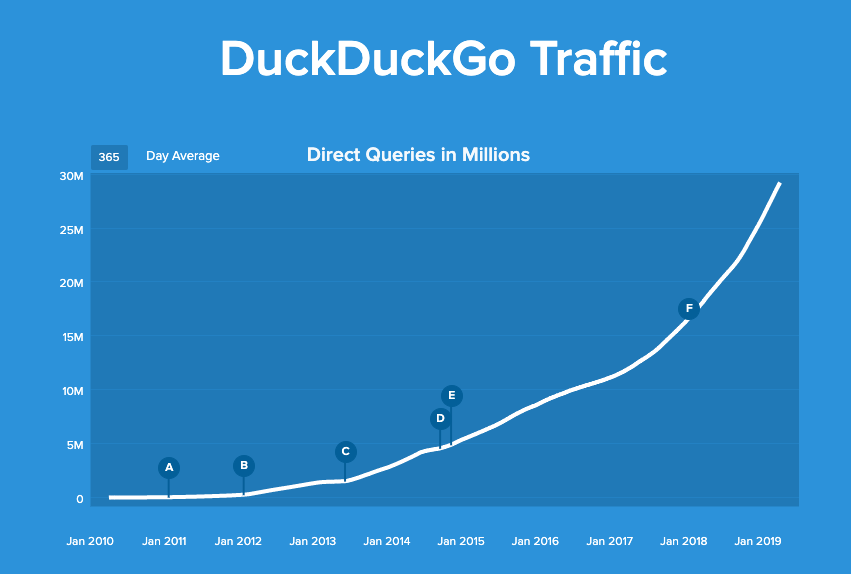
A closer look at DuckDuckGo’s stats indicates this growing interest in security and privacy. DuckDuckGo reached 10 million searches in one day back in 2015. It managed to reach 20 million searches in October 2018. In April 2019 it counts 38 million searches.
Making the most of DuckDuckGo
I’ve decided to try out DuckDuckGo after many years of using Google. The focus on online privacy along with the growing number of people switching to DuckDuckGo made it an intriguing choice.
The first impression seemed familiar. Simplicity and a minimal interface made the transition easy.
The fact that your searches are not personalized means that everyone can access the same results in a similar search. This seems to be a relief in the common pattern of the online filter bubbles that we’re used to be part of.
Another relief was the lack of endless ads before the actual search results. I’ve been used to the series of ads before the actual search results and the science of PPC from a professional perspective, but it was still a nice experience to find the direct results of my query. There was only one ad at the top of the search results, which I certainly wouldn’t mind seeing a similar limit to my Google results.
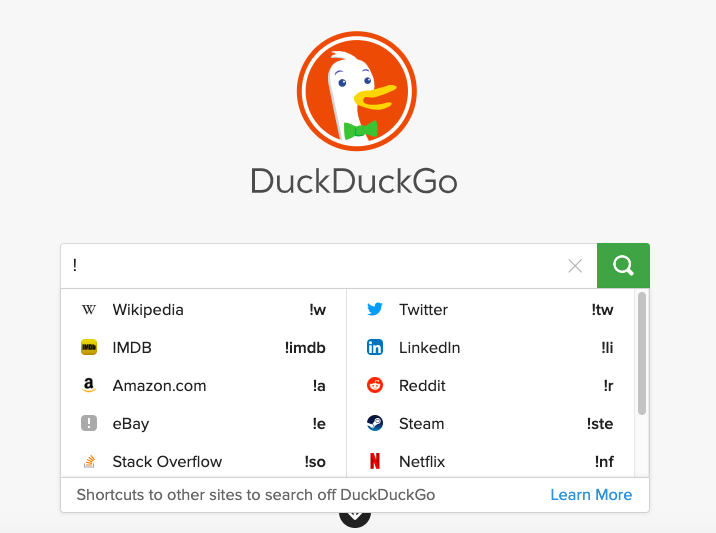
In addition to these, you can also save time from your searches by making the most of DuckDuckGo’s bangs. Bangs are shortcuts that allow you to search results on other sites. If you want to search for “SEO” on Search Engine Watch and you’re actually on DuckDuckGo’s homepage, all you need to do is to type ‘!searchenginewatch seo’
There are currently more than 12k bangs so you can search any of the big sites without visiting them in a different tab.
Finding the best search results — not everything is perfect
I must admit that the lack of personalization has its pros and cons. It is obviously reassuring to feel that you’re in control of your own data. However, you should also be prepared for the additional queries you might need to find the best results.
Forget queries like “cinemas near me” and “what’s playing”
The search results will be the same for everyone all over the world without detailed queries that could possibly help you get more personalized results.
Moreover, the actual search cannot compete with Google’s sophisticated search. After years of serving as the biggest search engine, there is a learning of semantics that leads to way better results compared to all other search engines.
This shouldn’t be a surprise and it should be clear when you’re jumping into DuckDuckGo that not everything will be the same.
There will also be an initial phase of learning the ropes of a new search experience, which is expected in every new tool and site.
Are these reasons enough to abandon DuckDuckGo? Not yet. It’s good to understand that it won’t replace Google anytime soon but this doesn’t mean that it doesn’t deserve a chance, especially if you’re serious about your online privacy when searching. I’ll personally give it a go knowing that if I can’t find a specific result, I can still use Google. I also enjoy their curated stories around privacy on their Twitter feed so it was an easy decision to follow them and stay up-to-date.
The choice is yours
The online world is changing. And we’re facing with numerous dilemmas when it comes to staying loyal to the big tech companies. As more data breaches and scandals show up, it’s up to us to decide whether we want to keep personalization or not.
There’s no right or wrong answer.
Google is certainly enjoying the success of the big search giant with a large index and search features that keep us hooked with along the numerous services we use on a daily basis. However, it’s refreshing to feel that we still have alternative options. Whether we use them or not, it’s up to us.
What’s important is to be conscious of your decision and your online privacy. The more informed we are, the better our online experience.
Tough competition on the ecommerce market makes retailers continuously search for new ideas to improve web stores’ UX. Optimizing the product page is one of the key areas in this quest for enhancements.
We reviewed the best practices of ecommerce leaders and success stories of smaller merchants, and came up with three hacks that make any product page convert more visitors into customers.
1. Optimize product descriptions
A good product description is a top factor influencing customers’ desire to purchase. The problem is customers want to get answers to their questions, but they don’t want to read a lot. Average web-surfers give a web page no more than 15 seconds to capture their attention. If a product description fails to meet this deadline, it fails to convert.
Customers think about different aspects of a product: Some are interested in materials, some are more concerned about durability. To make a product page convert well, you have to strike a balance between being informative and brief. Here are the best practices in product description derived from the success of market leaders:
Start with a unique value proposition: A brief product description that welcomes a potential shopper must clearly explain what is so special about this item. A selling product page doesn’t speak about features, it shows what particular benefits customers get when they buy the item.
Avoid visual overload: Structure key information using headers and collapsible sections to save space on the page. This makes product pages more transparent and interactive, as well as minimizes the time required to get the key ideas.
The screenshot below shows how Oliver implements these principles on their product pages. They hide the detailed information about product features, materials and delivery options in expandable sections.
Mulberry went a step further and combined tabs for Description, Details, Material, and Size Charts with pop-ups for Delivery and Returns. The result? All types of customers get excessive information about the product without reloads and scrolling.
The case of The Sims 3 manufacturers also proved that clarity and order drive conversion. They tested six versions of the “game launcher,” all of which had particular benefits, simpler design, and lesser information. As a result, conversion increased up to 128%.
2. Give people more images to describe items
Human beings are very good at processing visual information, much better than at reading. This means pictures and colors on product pages create the first impression of items and thus are even more important than descriptions.
Size matters: A product image is the only way for a customer to feel the product. So make sure that shoppers can zoom in to examine the product in detail (its fabric and tiny parts). These are not just words. Larger images helped Skinner Auctions by 63%. Skinner Auctions scaled their catalog images from 250 pixels to 350 pixels. And what’s even better? The amount of bidding visitors who actually filled out all the online forms required to place a bid rose to a huge 329%.
Angles matter as well: Surprisingly, it is a common mistake to show the product only facing forward. Customers want to see the interior pockets of a purse, the back of a dress, and the outsole of a shoe. A well-selling page features the product from different angles or even provides a video showing how it looks in motion. Look at ASOS, they allow you both to inspect the skirt’s texture and buttons and to watch a short video clip.
Customers want to try on items: Online shoppers are concerned about how items will suit real them rather than professional models. Many successful web stores show their products on people with different body shapes. This helps customers imagine themselves with items and make purchase decisions easier and faster.
We believe people more than models: Amazon and ModCloth ask their customers to share personal photos in the product reviews. Such a gallery is included in the product description to show customers how items look in everyday life and make the product page more trustworthy.
3. Dialog with customers
Do online retailers have fewer opportunities to talk to their customers than brick-and-mortar do? Not really. Though communication between web stores and shoppers doesn’t happen face to face, merchants can still say everything customers want to hear and ask for everything they need to know.
Add an FAQ and tips to the description to clarify any doubts. An FAQ has several benefits as it:
Answers the questions of the customers that are already on the page.
Attracts new visitors to product pages from the browser’s search results.
Helps keep product descriptions short.
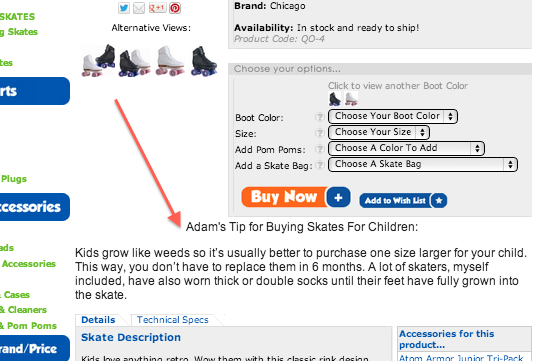
Apart from a full-fledged FAQ, you can try short tips as RollerSkateNation.com did. Their sincere advice was not oriented on increasing sales directly. In fact, it showed customers how to replace roller states for kids less frequently by buying larger items and wearing double socks. Customers felt taken care of and increased purchases by 69%.
The position of the tips and the FAQ section is also important. In the above case study, RollerSkateNation managed to further boost revenue by 99% by placing their hint below the product description. Customers had enough time to process key details and then got really useful advice as a surprise.
Use reviews to build trust. When it comes to making a purchase decision, reviews are almost as important as product descriptions and prices. Most shoppers look for reviews and, at best, they can read credible feedback right on the product page. This way customers don’t have to leave the web store and are less likely to choose another vendor. The case study of Express Watches proves that a well-designed Reviews section can increase conversion by 59%.What does this “well-designed” mean? The product page should let shoppers sort and rate reviews, add images and stars. To show even more credibility, you can pick some reviews and put them forward as testimonials.
And for sure be careful with negative reviews. Try to express your professionalism and care. In fact, a well-processed negative review can be even more convincing than a dozen positive ones.
Ask customers how to improve conversion. Small details, like words and button colors, influence the success of product pages. Though A/B tests make attempts to polish the web store less risky, don’t be shy to ask customers directly about their impression. For example, Amazon introduced a new feedback feature that shows how shoppers rate the size of the item.
By the way, this is a great CX feature per se that allows customers to quickly understand which size to take without exploring the size guide. But now pay extra attention to their poll about the utility of the feature. Why not ask customers if you can do it?
What’s next?
However good best practices are, they work well nine times out of ten. Unfortunately, there is no guarantee that your case isn’t the tenth one. Trust seals normally improve conversion as they make the website look trustworthy. But Icouponblog managed to increase their conversion by 400% by removing a security badge. What does this mean for you? The theory is worth reading, but real results appear only after you test and try. Devote enough time to validate your ideas, and you will definitely find the way to a high-converting product page.
Maria Marinina is a Digital Marketing Manager at Iflexion.
If content is queen, and the critical role SEO plays a role of bridging the two to drive growth, then there’s no question as to whether or not keyword research is important.
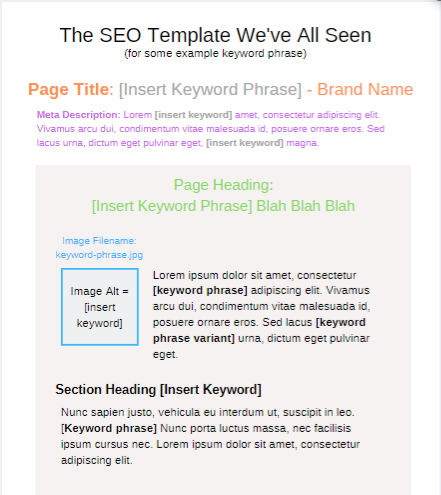
However, connecting the dots to create content that ranks well can be difficult. What makes it so difficult? How do you go from a target keyword phrase and write an article that is unique, comprehensive, encompasses all the major on-page SEO elements, touches the reader, and isn’t structured like the “oh-so-familiar” generic SEO template?
There’s no one size fits all approach! However, there is a simple way to support any member of your editorial, creative writing, or content team in shaping up what they need in order to write SEO-friendly content, and that’s an SEO content brief.
Key benefits of a content brief:
Productivity and efficiency – A content brief clearly outlines expectation for the writer resulting in reduced revisions
Alignment – Writers understand the intent and goals of the content
Quality – Reduces garbage in, garbage out.
So the rest of this article will cover how we actually get there & we’ll use this very article as an example:
Any good editor will tell you great content comes from having a solid content calendar with topics planned in advance for review and release at a regular cadence. To support topical analysis and themes as SEOs we need to start with keyword research.
Start with keyword research: Topic, audience, and objectives
The purpose of this guide isn’t to teach you how to do keyword research. It’s to set you up for success in taking the step beyond that and developing it into a content brief. Your primary keywords serve as your topic themes, but they are also the beginning makings of your content brief, so try to ensure you:
Spend time understanding your target audience and aligning their goals to your keywords. Many call this keyword intent mapping. Rohan Ayyr provides an excellent guide to matching keywords to intent in his article, ‘How to move from keyword research to intent research’.
Do the keyword research in advance, it will allow writers and editors the freedom to move things around and line it up with trending topics.
How does all this help in supporting a content brief?
You and your team can get answers to the key questions mentioned below.
What will they write about? Primary keywords serve as the topic in your content brief.
Who is the intended audience? Keyword intent helps unearth what problem the user is trying to solve, helping us understand who they are, and what they need.
Now with keywords as our guide to overall topical themes, we can focus on the next step, topical expansion.
Topical expansion: Define key points and gather questions
Writers need more than keywords, they require insight into the pain points of the reader, key areas of the topic to address and most of all, what questions the content should answer. This too will go into your content brief.
We’re in luck as SEOs because there is no shortage of tools that allow us to gather this information around a topic.
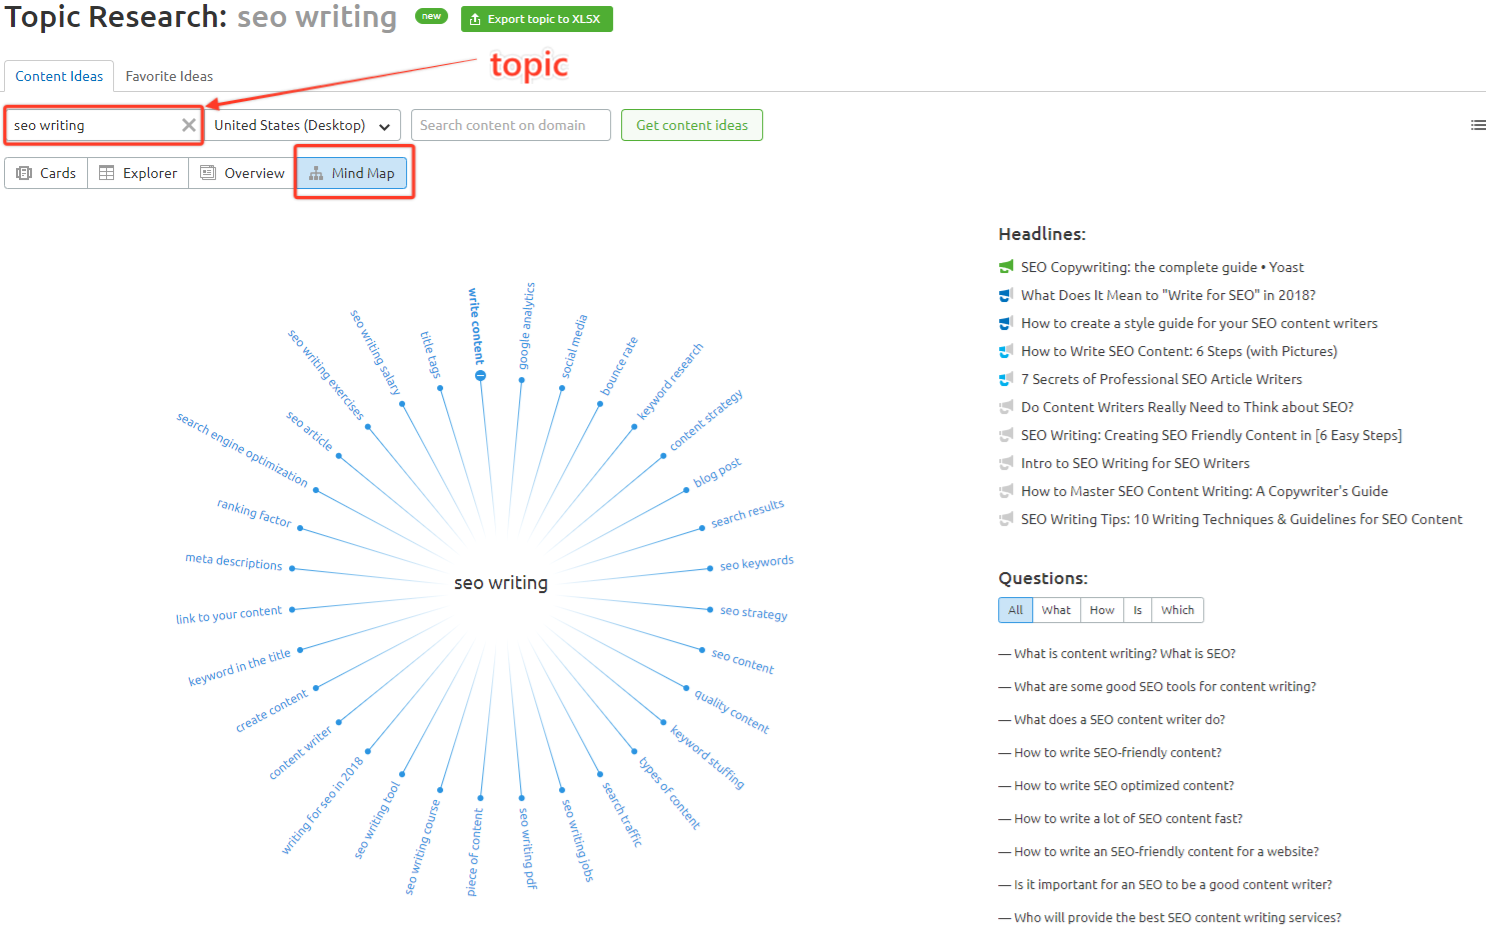
For example, let’s say this article focuses on “SEO writing”. There are a number of ways to expand on this topic.
Using a tool like SEMRush’s topic research tool, you can take your primary keyword (topic), and get expanded/related topics, a SERP snapshot and questions in a single view. I like this because it covers what many other tools do separately. Ultimately it supports both content expansion & SERP analysis at the same time.
Use keyword suggestion tools like KeywordTool.io or Ubersuggest to expand the terms combined with Google search results to quickly view potential topics.
Use Answerthepublic.com to get expanded terms and inspirational visuals.
You’ve taken note of what to write about, and how to cover the topic fully. But how do we begin to determine what type of content and how in-depth it should be?
Content and SERP analysis: Specifying content type and format
Okay, so we’re almost done. We can’t tell writers to write unique content if we can’t specify what makes it unique. Reviewing the competition and what’s being displayed consistently in the SERP is a quick way to assess what’s likely to work. You’ll want to look at the top ten results for your primary topic and collect the following:
Content type – Are the results skewed towards a specific type of content? (For example, in-depth articles, infographics, videos, or blog posts)
Format – Is the information formatted as a guide? A how-to? Maybe a list?
Differentiation points – What stands out about the top three results compared to the rest?
Content brief development: Let’s make beautiful content together
Now you’re ready to prepare your SEO content brief which should include the following:
Topic and objective – Your topic is your primary keyword phrase. Your objective is what this content supposed to accomplish.
Audience and objective – Based on your keyword intent mapping, describe who the article is meant to reach.
Topical coverage – Top three related keyword phrases from your topical expansion.
Questions to answer – Top three to five from topical expansion findings. Ensure they support your related keyword phrases as well.
Voice, style, tone – Use an existing content/brand style guide.
Content type and format – Based on your SERP analysis.
Content length – Based on SERP Analysis. Ensure you’re meeting the average across the top three results based on content type.
Deadline – This is only pertinent if you are working solo, otherwise, consult/lean on your creative team lead.
[Note: If/when using internally, consider making part of the content request process, or a template for the editorial staff. When using externally be sure to include where the content will be displayed, format/output, specialty editorial guidance.]
Template and tools
Want to take a shortcut? Feel free to download and copy my SEO content brief template, it’s a Google doc.
If you want to streamline the process as a whole, MarketMuse provides a platform that manages the keyword research, topic expansion, provides the questions, and manages the entire workflow. It even allows you to request a brief, all in one place.
I only suggest this for larger organizations looking to scale as there is an investment involved. You’d likely also have to do some work to integrate into your existing processes.
Jori Ford is Sr. Director of Content & SEO at G2Crowd. She can also be found on Twitter @chicagoseopro.
YouTube is not just a social media platform. It’s a powerful search engine for video content. Here’s how to make the most of its SEO potential.
There are more than 1.9 billion users who use YouTube every month. People are spending over a billion hours watching videos every day on YouTube. This means that there is a big opportunity for brands, publishers and video creators to expand their reach.
Search optimization is not just for your site’s content. YouTube can have its own best practices around SEO and it’s good to keep up with the most important ones that can improve your ranking.
How can you improve your SEO on YouTube? We’ve organized our advanced YouTube SEO tactics into three key areas:
Keyword research
Content optimization
Engagement
Advanced YouTube SEO tips to drive more traffic and improved rankings
Keyword research
It’s not enough to create the right content if you don’t get new viewers to actually watch it. Keywords can actually help you understand how to link your video with the best words to describe it.
They can make it easier for viewers to discover your content and they also help search engines match the content with the search queries and their relevance.
A video keyword research can help you discover new content opportunities while you can also improve your SEO.
A quick way to find popular keywords for the content you have in mind is to start searching on YouTube’s search bar. The auto-complete feature will highlight the most popular keywords around your topic. You can also perform a similar search in Google to come up with more suggestions for the best keywords.
If you’re serious about keyword research and need to find new ideas, you can use additional online tools that will provide with a list of keywords to consider.
When it comes to picking the best keywords, you don’t need to aim for the most obvious choice. You can start with the keywords that are low in competition and aim to rank for them.
Moreover, it’s good to keep in mind that YouTube is transcribing all your videos. If you want to establish your focus keywords you can include them in your actual video by mentioning throughout your talking. This way you’re helping YouTube understand the contextual relevance of your content along with your keywords.
Recap
Use the auto-complete search function to find popular keywords
Perform a Google search for more keyword ideas
You can even use SEO tools for additional keyword ideas
Say your keywords as part of your videos
Content optimization
There are many ways to improve the optimization of your content and here are some key tips to keep in mind:
1. Description
Your description should facilitate the search for relevant content. A long description helps you provide additional context to your video. It can also serve as an introduction to what you’re going to talk about. As with blog posts, a longer description can grant you the space to expand your thoughts. Start treating your videos as the starting point and add further details about them in the description. If your viewers are genuinely interested in your videos then they will actually search for additional details in your description.
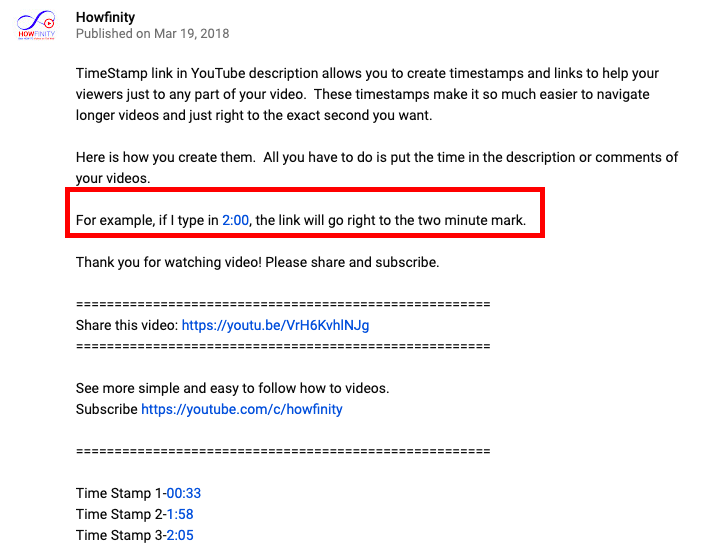
2. Timestamp
More videos are adding timestamps in their description. This is a great way to improve user experience and engagement. You are helping your viewers to find exactly what they are looking for, which increases the chances of keeping them coming back.
3. Title and keywords
Keywords are now clickable in titles. This means that you are increasing the chances of boosting your SEO by being more creative with your titles. Be careful not to create content just for search engines though, always start by creating content that your viewers would enjoy.
4. Location
If you want to tap into local SEO then it’s a good idea to include your location in your video’s copy. If you want to create videos that are targeting local viewers then it’s a great starting point for your SEO strategy.
5. Video transcripts
Video transcripts make your videos more accessible. They also make it easier for search engines to understand what the video is about. Think of the transcript as the process that makes the crawling of your content easier. There are many online options to create your video transcripts so it shouldn’t be a complicated process to add them to your videos.
Engagement
Engagement keeps gaining ground when it comes to YouTube SEO. It’s not enough to count the number of views if your viewers are not engaging with your content. User behavior helps search engines understand whether your content is useful or interesting for your viewers to rank it accordingly.
Thus, it’s important to pay attention to these metrics:
Watch time: The time that your viewers are spending on your video is a good indicator of its appeal and relevance to them.
Likes, comments, and shares: The starting point of measuring engagement is to track the number of likes, comments, and shares in your videos. They don’t make the only engagement metric anymore but they can still serve as a good indication of what counts as popular content. Likes may be easier to achieve but comments and most importantly shares can skyrocket the engagement and views of your videos. It’s not a bad idea to encourage your viewers to support your work. It is actually a common tactic. However, make sure that you’re not trying too hard as this is not appreciated. Every call-to-action needs to feel natural in your videos.
Subscribers after watching a video: The number of subscribers serves as an indication of your channel’s popularity. People who actually subscribe to your channel after watching a video make a very good indication of your content’s engagement.
CTR: The click-through rate (CTR) is the number of clicks your video is receiving based on the impressions, the number of times that it’s shown. For example, if you optimize your content to show up high in rankings but it still doesn’t get too many clicks, then it means that your viewers don’t find it appealing enough to click on it. This may not be related to the quality of your content but on the first impression that it gets. You can improve the CTR by paying attention to your title and your thumbnail. Bear in mind that YouTube is not encouraging you to clickbait your viewers, so you shouldn’t create misleading titles or thumbnails if you want to aim for higher rankings in the longer term.
Learning from the best
A good tip to understand YouTube SEO is to learn from the best by looking at the current most popular videos. You can also search for topics that are relevant to your channel to spot how your competitors are optimizing their titles, their keywords, and how thumbnails and descriptions can make it easier to click on one video over another.
Have any queries or tips to add to these? Share them in the comments.
When you incorporate machine learning techniques to speed up SEO recovery, the results can be amazing.
This is the third and last installment from our series on using Python to speed SEO traffic recovery. In part one, I explained how our unique approach, that we call “winners vs losers” helps us quickly narrow down the pages losing traffic to find the main reason for the drop. In part two, we improved on our initial approach to manually group pages using regular expressions, which is very useful when you have sites with thousands or millions of pages, which is typically the case with ecommerce sites. In part three, we will learn something really exciting. We will learn to automatically group pages using machine learning.
As mentioned before, you can find the code used in part one, two and three in this Google Colab notebook.
Let’s get started.
URL matching vs content matching
When we grouped pages manually in part two, we benefited from the fact the URLs groups had clear patterns (collections, products, and the others) but it is often the case where there are no patterns in the URL. For example, Yahoo Stores’ sites use a flat URL structure with no directory paths. Our manual approach wouldn’t work in this case.
Fortunately, it is possible to group pages by their contents because most page templates have different content structures. They serve different user needs, so that needs to be the case.
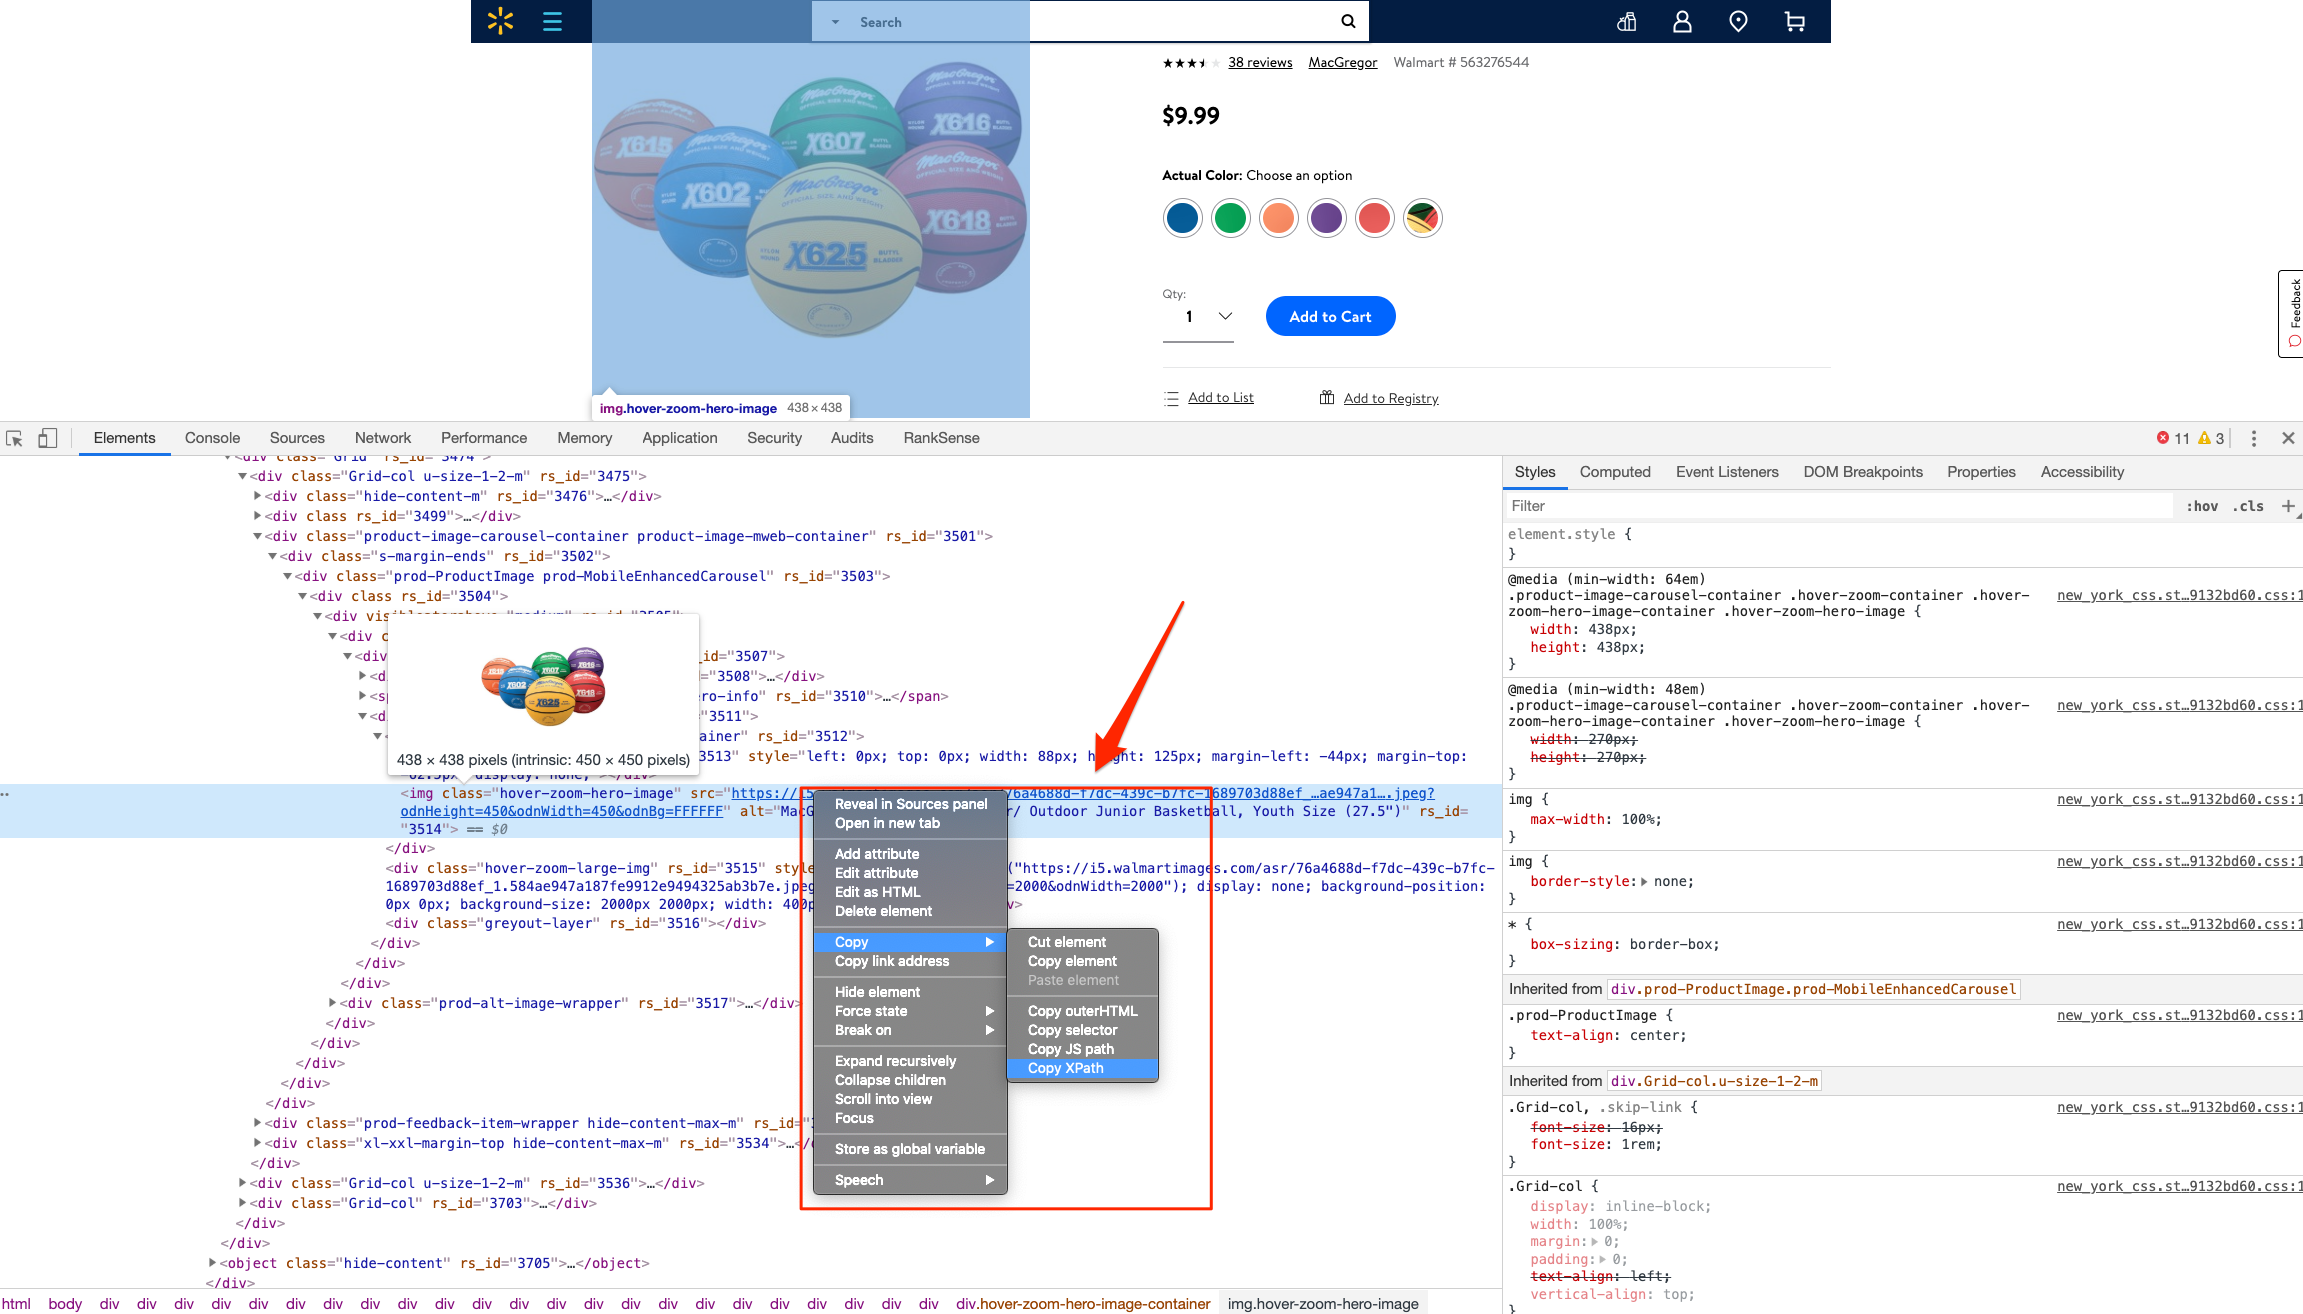
How can we organize pages by their content? We can use DOM element selectors for this. We will specifically use XPaths.
For example, I can use the presence of a big product image to know the page is a product detail page. I can grab the product image address in the document (its XPath) by right-clicking on it in Chrome and choosing “Inspect,” then right-clicking to copy the XPath.
We can identify other page groups by finding page elements that are unique to them. However, note that while this would allow us to group Yahoo Store-type sites, it would still be a manual process to create the groups.
A scientist’s bottom-up approach
In order to group pages automatically, we need to use a statistical approach. In other words, we need to find patterns in the data that we can use to cluster similar pages together because they share similar statistics. This is a perfect problem for machine learning algorithms.
BloomReach, a digital experience platform vendor, shared their machine learning solution to this problem. To summarize it, they first manually selected cleaned features from the HTML tags like class IDs, CSS style sheet names, and the others. Then, they automatically grouped pages based on the presence and variability of these features. In their tests, they achieved around 90% accuracy, which is pretty good.
When you give problems like this to scientists and engineers with no domain expertise, they will generally come up with complicated, bottom-up solutions. The scientist will say, “Here is the data I have, let me try different computer science ideas I know until I find a good solution.”
One of the reasons I advocate practitioners learn programming is that you can start solving problems using your domain expertise and find shortcuts like the one I will share next.
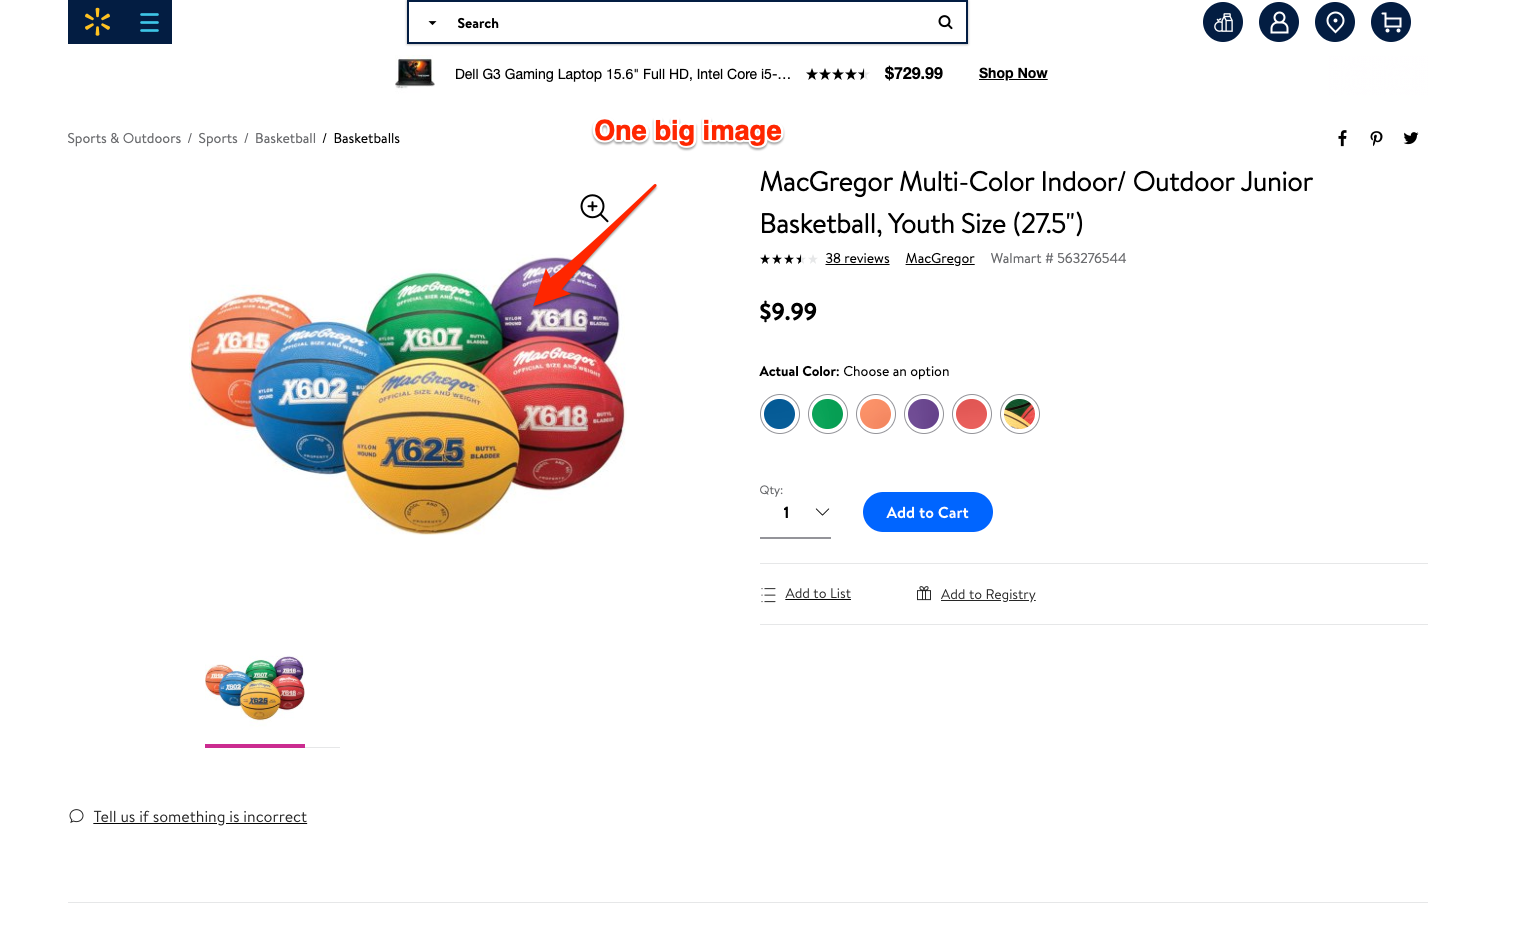
Hamlet’s observation and a simpler solution
For most ecommerce sites, most page templates include images (and input elements), and those generally change in quantity and size.
I decided to test the quantity and size of images, and the number of input elements as my features set. We were able to achieve 97.5% accuracy in our tests. This is a much simpler and effective approach for this specific problem. All of this is possible because I didn’t start with the data I could access, but with a simpler domain-level observation.
I am not trying to say my approach is superior, as they have tested theirs in millions of pages and I’ve only tested this on a few thousand. My point is that as a practitioner you should learn this stuff so you can contribute your own expertise and creativity.
Now let’s get to the fun part and get to code some machine learning code in Python!
Collecting training data
We need training data to build a model. This training data needs to come pre-labeled with “correct” answers so that the model can learn from the correct answers and make its own predictions on unseen data.
In our case, as discussed above, we’ll use our intuition that most product pages have one or more large images on the page, and most category type pages have many smaller images on the page.
What’s more, product pages typically have more form elements than category pages (for filling in quantity, color, and more).
Unfortunately, crawling a web page for this data requires knowledge of web browser automation, and image manipulation, which are outside the scope of this post. Feel free to study this GitHub gist we put together to learn more.
Here we load the raw data already collected.
Feature engineering
Each row of the form_counts data frame above corresponds to a single URL and provides a count of both form elements, and input elements contained on that page.
Meanwhile, in the img_counts data frame, each row corresponds to a single image from a particular page. Each image has an associated file size, height, and width. Pages are more than likely to have multiple images on each page, and so there are many rows corresponding to each URL.
It is often the case that HTML documents don’t include explicit image dimensions. We are using a little trick to compensate for this. We are capturing the size of the image files, which would be proportional to the multiplication of the width and the length of the images.
We want our image counts and image file sizes to be treated as categorical features, not numerical ones. When a numerical feature, say new visitors, increases it generally implies improvement, but we don’t want bigger images to imply improvement. A common technique to do this is called one-hot encoding.
Most site pages can have an arbitrary number of images. We are going to further process our dataset by bucketing images into 50 groups. This technique is called “binning”.
Here is what our processed data set looks like.
Adding ground truth labels
As we already have correct labels from our manual regex approach, we can use them to create the correct labels to feed the model.
We also need to split our dataset randomly into a training set and a test set. This allows us to train the machine learning model on one set of data, and test it on another set that it’s never seen before. We do this to prevent our model from simply “memorizing” the training data and doing terribly on new, unseen data. You can check it out at the link given below:
Model training and grid search
Finally, the good stuff!
All the steps above, the data collection and preparation, are generally the hardest part to code. The machine learning code is generally quite simple.
We’re using the well-known Scikitlearn python library to train a number of popular models using a bunch of standard hyperparameters (settings for fine-tuning a model). Scikitlearn will run through all of them to find the best one, we simply need to feed in the X variables (our feature engineering parameters above) and the Y variables (the correct labels) to each model, and perform the .fit() function and voila!
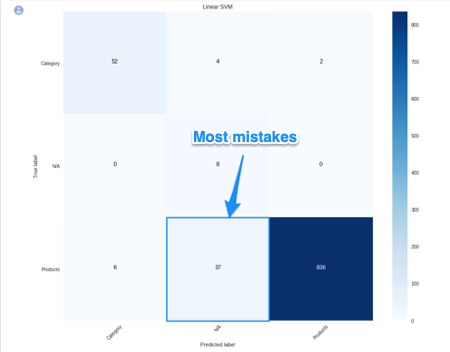
Evaluating performance
After running the grid search, we find our winning model to be the Linear SVM (0.974) and Logistic regression (0.968) coming at a close second. Even with such high accuracy, a machine learning model will make mistakes. If it doesn’t make any mistakes, then there is definitely something wrong with the code.
In order to understand where the model performs best and worst, we will use another useful machine learning tool, the confusion matrix.
When looking at a confusion matrix, focus on the diagonal squares. The counts there are correct predictions and the counts outside are failures. In the confusion matrix above we can quickly see that the model does really well-labeling products, but terribly labeling pages that are not product or categories. Intuitively, we can assume that such pages would not have consistent image usage.
Here is the code to put together the confusion matrix:
Finally, here is the code to plot the model evaluation:
Resources to learn more
You might be thinking that this is a lot of work to just tell page groups, and you are right!
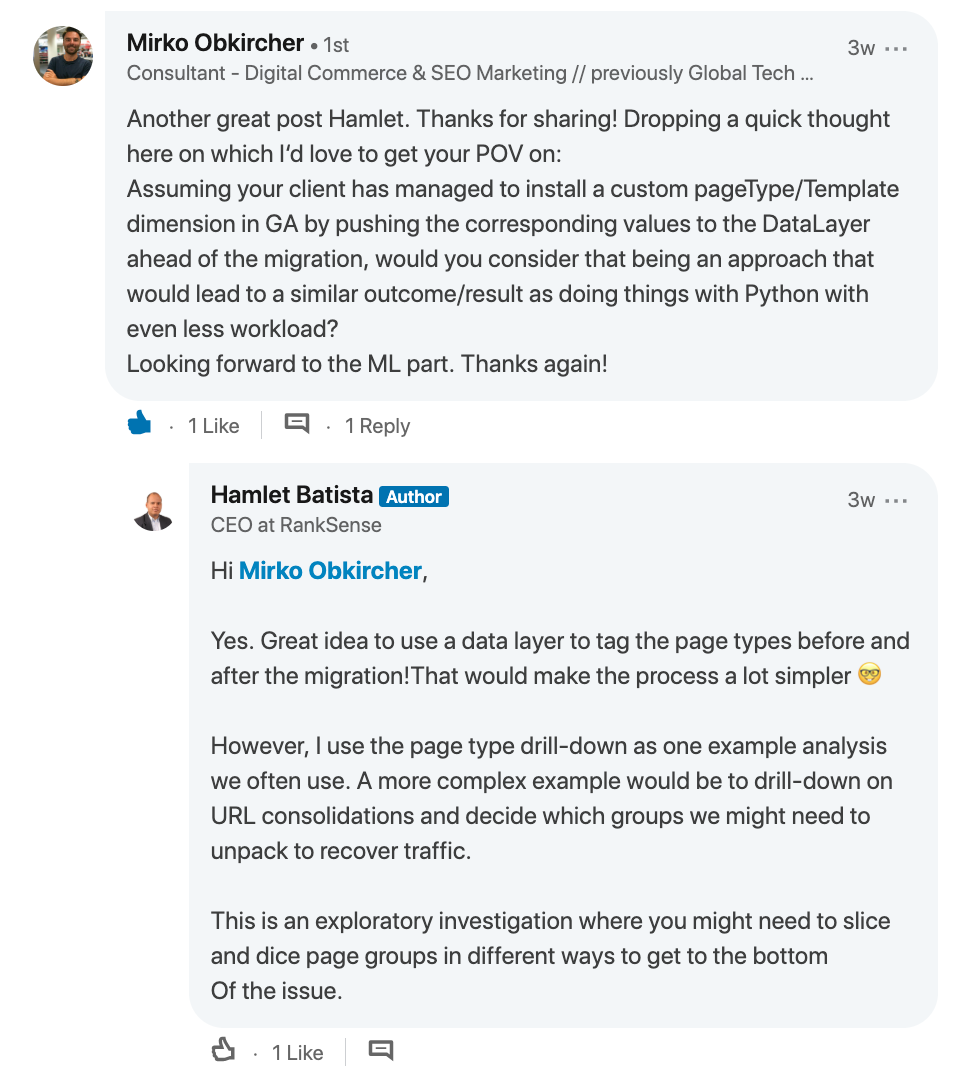
Mirko Obkircher commented in my article for part two that there is a much simpler approach, which is to have your client set up a Google Analytics data layer with the page group type. Very smart recommendation, Mirko!
I am using this example for illustration purposes. What if the issue requires a deeper exploratory investigation? If you already started the analysis using Python, your creativity and knowledge are the only limits.
If you want to jump onto the machine learning bandwagon, here are some resources I recommend to learn more:
Attend a Pydata event I got motivated to learn data science after attending the event they host in New York.
If you are starting from scratch and want to learn fast, I’ve heard good things about Data Camp.
Got any tips or queries? Share it in the comments.
Hamlet Batista is the CEO and founder of RankSense, an agile SEO platform for online retailers and manufacturers. He can be found on Twitter @hamletbatista.
“So… most businesses know about voice search. But has this knowledge helped them optimize for it?”
An interesting report recently released by Uberall sought to address that exact question. For as much as we talk about the importance of voice search, and even how to optimize for it — are people actually doing it?
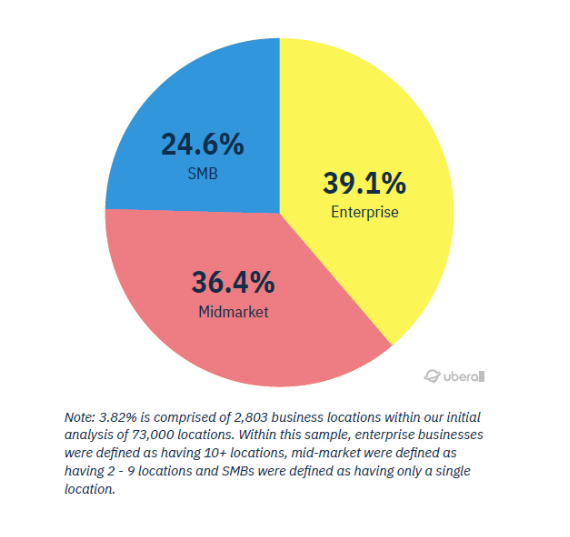
In this report, researchers analyzed 73,000 business locations (using the Boston Metro area as their sample set), across 37 different voice search directories, as well as across SMBs, mid-market, and enterprise.
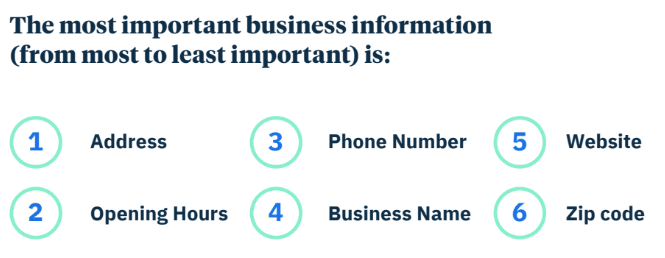
They looked at a number of factors including accuracy of address, business hours, phone number, name, website, and zip code, as well as accuracy across various voice search directories.
In order, this was how they weighted the importance of a listing’s information:
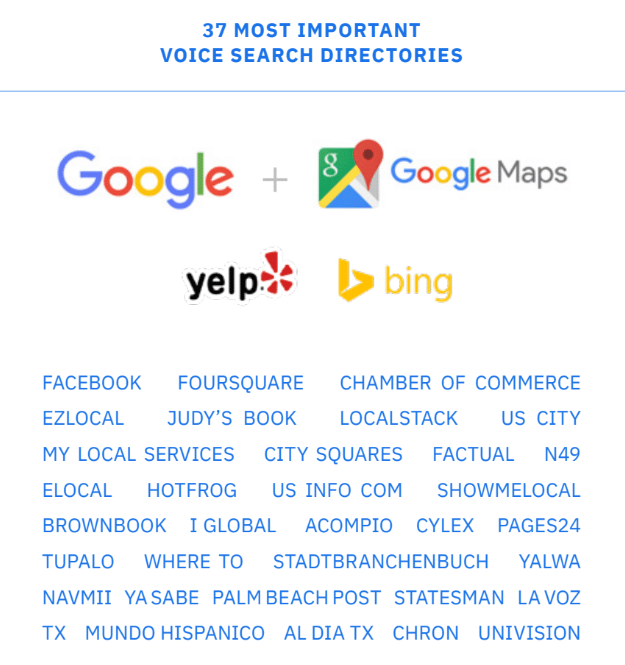
And pictured below are “the 37 most important voice search directories” that they accounted for.
Uberall analysts did note, however, that Google (search + maps), Yelp, and Bing together represent about 90% of the score’s weight.
How ready are businesses for voice search?
The ultimate question. Here, we’ll dive into a few key findings from this report.
1. Over 96% of all business locations fail to list their business information correctly
When looking just at the three primary listings locations (Google, Yelp, Bing), Uberall found that only 3.82% of business locations had no critical errors.
In other words, more than 96% of all business locations failed to list their business information correctly.
Breaking down those 3.82% of perfect business location listings, they were somewhat evenly split across enterprise, mid-market, and SMB, with enterprise having the largest share as one might expect.
2. The four most common types of listing errors
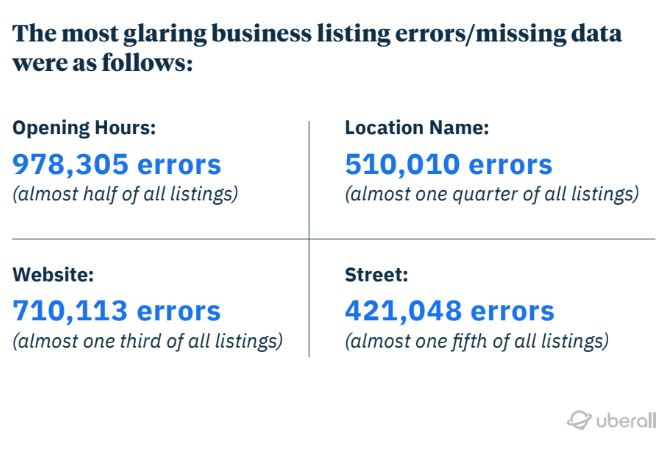
In their analysis, here’s the breakdown of most common types of missing or incorrect information:
Opening hours: 978,305 errors (almost half of all listings)
Website: 710,113 errors (almost one-third of all listings)
Location name: 510,010 errors (almost one-quarter of all listings)
Street: 421,048 errors (almost one-fifth of all listings)
3. Which types of businesses are most likely to be optimized for voice search?
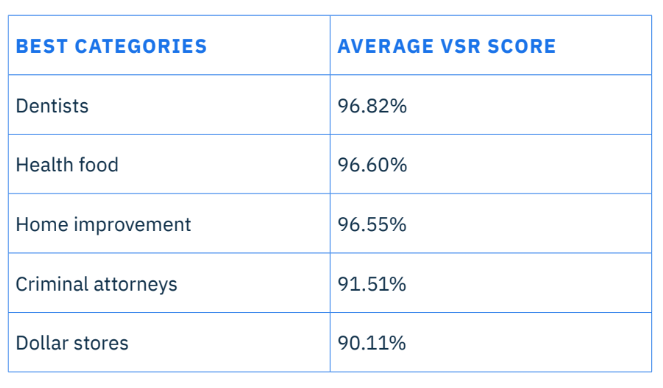
Industries that were found to be most voice search ready included:
Dentists
Health food
Home improvement
Criminal attorneys
Dollar stores
Industries that were found to be least voice search ready included:
Consumer protection organizations
Congressional representatives
Business attorneys
Art galleries
Wedding services
Not much surprise on the most-prepared industries relying heavily on people being able to find their physical locations. Perhaps a bit impressed that criminal attorneys landed so high on the list. Surprising that art galleries ranked second to last, but perhaps this helps explain decline in traffic of late.
And as ever, we can be expectedly disappointed by the technological savvy of congressional representatives.
What’s the cost of businesses not being optimized for voice search?
The next question, of course, is: how much should we care? Uberall spent a nice bit of their report discussing statistics about the history of voice search, how much it’s used, and its predicted growth.
Interestingly, they also take a moment to fact check the popular “voice will be 50% of all search by 2020” statistic. Apparently, this was taken from an interview with Andrew Ng (co-founder of Coursera, formerly lead at both Google Brain and Baidu) and was originally referring to the growth of a combined voice and image search, specifically via Baidu in China.
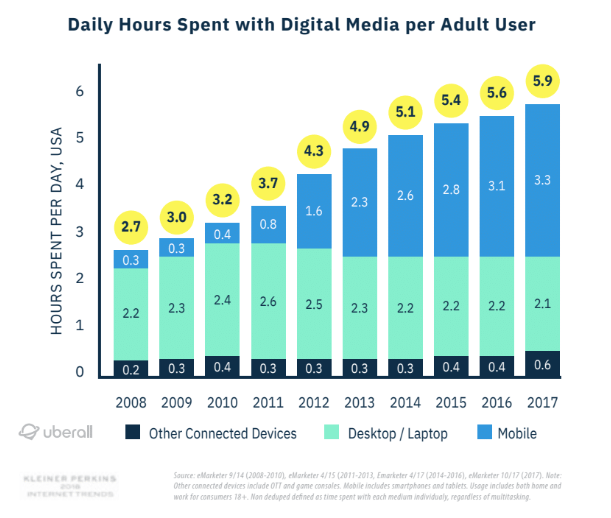
1. On average, adults spend 10x more hours on their phones than they did in 2018
This data was compiled from a number of charts from eMarketer, showing overall increase in digital media use from 2008 to 2017 (and we can imagine is even higher now). Specifically, we see how most all of the growth is driven just from mobile.
The connection here, of course, is that mobile devices are one of the most popular devices for voice search, second only perhaps to smart home devices.
2. About 21% of respondents were using voice search every week
According to this study, 21% of respondents were using voice search every week. 57% of respondents said they never used voice search. And about 14% seem to have tried it once or twice and not looked back.
In general, it seems people are a bit polarized — either it’s a habit or it’s not.
Regardless, 21% is a sizable number of consumers (though we don’t have information about how many of those searches convert to purchases).
And it seems the number is on the rise: the recent report from voicebot.ai showed that smart speaker ownership grew by nearly 40% from 2018 to 2019, among US adults.
Overall, the cost of not being optimized for voice search may not be sky high yet. But at the same time, it’s probably never too soon to get your location listings in order and provide accurate information to consumers.