Wednesday, 17 April 2019

The Fractured Web

Anyone can argue about the intent of a particular action & the outcome that is derived by it. But when the outcome is known, at some point the intent is inferred if the outcome is derived from a source of power & the outcome doesn't change.

Or, put another way, if a powerful entity (government, corporation, other organization) disliked an outcome which appeared to benefit them in the short term at great lasting cost to others, they could spend resources to adjust the system.

If they don't spend those resources (or, rather, spend them on lobbying rather than improving the ecosystem) then there is no desired change. The outcome is as desired. Change is unwanted.

News is a stock vs flow market where the flow of recent events drives most of the traffic to articles. News that is more than a couple days old is no longer news. A news site which stops publishing news stops becoming a habit & quickly loses relevancy. Algorithmically an abandoned archive of old news articles doesn't look much different than eHow, in spite of having a much higher cost structure.

According to SEMrush's traffic rank, ampproject.org gets more monthly visits than Yahoo.com.

Traffic Ranks.

That actually understates the prevalence of AMP because AMP is generally designed for mobile AND not all AMP-formatted content is displayed on ampproject.org.

Part of how AMP was able to get widespread adoption was because in the news vertical the organic search result set was displaced by an AMP block. If you were a news site either you were so differentiated that readers would scroll past the AMP block in the search results to look for you specifically, or you adopted AMP, or you were doomed.

Some news organizations like The Guardian have a team of about a dozen people reformatting their content to the duplicative & proprietary AMP format. That's wasteful, but necessary "In theory, adoption of AMP is voluntary. In reality, publishers that don’t want to see their search traffic evaporate have little choice. New data from publisher analytics firm Chartbeat shows just how much leverage Google has over publishers thanks to its dominant search engine."

It seems more than a bit backward that low margin publishers are doing duplicative work to distance themselves from their own readers while improving the profit margins of monopolies. But it is what it is. And that no doubt drew the ire of many publishers across the EU.

And now there are AMP Stories to eat up even more visual real estate.

If you spent a bunch of money to create a highly differentiated piece of content, why would you prefer that high spend flaghship content appear on a third party website rather than your own?

Google & Facebook have done such a fantastic job of eating the entire pie that some are celebrating Amazon as a prospective savior to the publishing industry. That view - IMHO - is rather suspect.

Where any of the tech monopolies dominate they cram down on partners. The New York Times acquired The Wirecutter in Q4 of 2016. In Q1 of 2017 Amazon adjusted their affiliate fee schedule.

Amazon generally treats consumers well, but they have been much harder on business partners with tough pricing negotiations, counterfeit protections, forced ad buying to have a high enough product rank to be able to rank organically, ad displacement of their organic search results below the fold (even for branded search queries), learning suppliers & cutting out the partners, private label products patterned after top sellers, in some cases running pop over ads for the private label products on product level pages where brands already spent money to drive traffic to the page, etc.

They've made things tougher for their partners in a way that mirrors the impact Facebook & Google have had on online publishers:

"Boyce’s experience on Amazon largely echoed what happens in the offline world: competitors entered the market, pushing down prices and making it harder to make a profit. So Boyce adapted. He stopped selling basketball hoops and developed his own line of foosball tables, air hockey tables, bocce ball sets and exercise equipment. The best way to make a decent profit on Amazon was to sell something no one else had and create your own brand. ... Amazon also started selling bocce ball sets that cost $15 less than Boyce’s. He says his products are higher quality, but Amazon gives prominent page space to its generic version and wins the cost-conscious shopper."

Google claims they have no idea how content publishers are with the trade off between themselves & the search engine, but every quarter Alphabet publish the share of ad spend occurring on owned & operated sites versus the share spent across the broader publisher network. And in almost every quarter for over a decade straight that ratio has grown worse for publishers.

The aggregate numbers for news publishers are worse than shown above as Google is ramping up ads in video games quite hard. They've partnered with Unity & promptly took away the ability to block ads from appearing in video games using googleadsenseformobileapps.com exclusion (hello flat thumb misclicks, my name is budget & I am gone!)

They will also track video game player behavior & alter game play to maximize revenues based on machine learning tied to surveillance of the user's account: "We’re bringing a new approach to monetization that combines ads and in-app purchases in one automated solution. Available today, new smart segmentation features in Google AdMob use machine learning to segment your players based on their likelihood to spend on in-app purchases. Ad units with smart segmentation will show ads only to users who are predicted not to spend on in-app purchases. Players who are predicted to spend will see no ads, and can simply continue playing."

And how does the growth of ampproject.org square against the following wisdom?

Literally only yesterday did Google begin supporting instant loading of self-hosted AMP pages.

China has a different set of tech leaders than the United States. Baidu, Alibaba, Tencent (BAT) instead of Facebook, Amazon, Apple, Netflix, Google (FANG). China tech companies may have won their domestic markets in part based on superior technology or better knowledge of the local culture, though those same companies have largely went nowhere fast in most foreign markets. A big part of winning was governmental assistance in putting a foot on the scales.

Part of the US-China trade war is about who controls the virtual "seas" upon which value flows:

it can easily be argued that the last 60 years were above all the era of the container-ship (with container-ships getting ever bigger). But will the coming decades still be the age of the container-ship? Possibly not, for the simple reason that things that have value increasingly no longer travel by ship, but instead by fiberoptic cables! ... you could almost argue that ZTE and Huawei have been the “East India Company” of the current imperial cycle. Unsurprisingly, it is these very companies, charged with laying out the “new roads” along which “tomorrow’s value” will flow, that find themselves at the center of the US backlash. ... if the symbol of British domination was the steamship, and the symbol of American strength was the Boeing 747, it seems increasingly clear that the question of the future will be whether tomorrow’s telecom switches and routers are produced by Huawei or Cisco. ... US attempts to take down Huawei and ZTE can be seen as the existing empire’s attempt to prevent the ascent of a new imperial power. With this in mind, I could go a step further and suggest that perhaps the Huawei crisis is this century’s version of Suez crisis. No wonder markets have been falling ever since the arrest of the Huawei CFO. In time, the Suez Crisis was brought to a halt by US threats to destroy the value of sterling. Could we now witness the same for the US dollar?

China maintains Huawei is an employee-owned company. But that proposition is suspect. Broadly stealing technology is vital to the growth of the Chinese economy & they have no incentive to stop unless their leading companies pay a direct cost. Meanwhile, China is investigating Ericsson over licensing technology.

India has taken notice of the success of Chinese tech companies & thus began to promote "national champion" company policies. That, in turn, has also meant some of the Chinese-styled laws requiring localized data, antitrust inquiries, foreign ownership restrictions, requirements for platforms to not sell their own goods, promoting limits on data encryption, etc.

The secretary of India’s Telecommunications Department, Aruna Sundararajan, last week told a gathering of Indian startups in a closed-door meeting in the tech hub of Bangalore that the government will introduce a “national champion” policy “very soon” to encourage the rise of Indian companies, according to a person familiar with the matter. She said Indian policy makers had noted the success of China’s internet giants, Alibaba Group Holding Ltd. and Tencent Holdings Ltd. ... Tensions began rising last year, when New Delhi decided to create a clearer set of rules for e-commerce and convened a group of local players to solicit suggestions. Amazon and Flipkart, even though they make up more than half the market, weren’t invited, according to people familiar with the matter.

Amazon vowed to invest $5 billion in India & they have done some remarkable work on logistics there. Walmart acquired Flipkart for $16 billion.

Other emerging markets also have many local ecommerce leaders like Jumia, MercadoLibre, OLX, Gumtree, Takealot, Konga, Kilimall, BidOrBuy, Tokopedia, Bukalapak, Shoppee, Lazada. If you live in the US you may have never heard of *any* of those companies. And if you live in an emerging market you may have never interacted with Amazon or eBay.

It makes sense that ecommerce leadership would be more localized since it requires moving things in the physical economy, dealing with local currencies, managing inventory, shipping goods, etc. whereas information flows are just bits floating on a fiber optic cable.

If the Internet is primarily seen as a communications platform it is easy for people in some emerging markets to think Facebook is the Internet. Free communication with friends and family members is a compelling offer & as the cost of data drops web usage increases.

At the same time, the web is incredibly deflationary. Every free form of entertainment which consumes time is time that is not spent consuming something else.

Add the technological disruption to the wealth polarization that happened in the wake of the great recession, then combine that with algorithms that promote extremist views & it is clearly causing increasing conflict.

If you are a parent and you think you child has no shot at a brighter future than your own life it is easy to be full of rage.

Empathy can radicalize otherwise normal people by giving them a more polarized view of the world:

Starting around 2000, the line starts to slide. More students say it's not their problem to help people in trouble, not their job to see the world from someone else's perspective. By 2009, on all the standard measures, Konrath found, young people on average measure 40 percent less empathetic than my own generation ... The new rule for empathy seems to be: reserve it, not for your "enemies," but for the people you believe are hurt, or you have decided need it the most. Empathy, but just for your own team. And empathizing with the other team? That's practically a taboo.

A complete lack of empathy could allow a psychopath (hi Chris!) to commit extreme crimes while feeling no guilt, shame or remorse. Extreme empathy can have the same sort of outcome:

"Sometimes we commit atrocities not out of a failure of empathy but rather as a direct consequence of successful, even overly successful, empathy. ... They emphasized that students would learn both sides, and the atrocities committed by one side or the other were always put into context. Students learned this curriculum, but follow-up studies showed that this new generation was more polarized than the one before. ... [Empathy] can be good when it leads to good action, but it can have downsides. For example, if you want the victims to say 'thank you.' You may even want to keep the people you help in that position of inferior victim because it can sustain your feeling of being a hero." - Fritz Breithaupt

News feeds will be read. Villages will be razed. Lynch mobs will become commonplace.

Many people will end up murdered by algorithmically generated empathy.

As technology increases absentee ownership & financial leverage, a society led by morally agnostic algorithms is not going to become more egalitarian.

When politicians throw fuel on the fire it only gets worse:

It’s particularly odd that the government is demanding “accountability and responsibility” from a phone app when some ruling party politicians are busy spreading divisive fake news. How can the government ask WhatsApp to control mobs when those convicted of lynching Muslims have been greeted, garlanded and fed sweets by some of the most progressive and cosmopolitan members of Modi’s council of ministers?

Mark Zuckerburg won't get caught downstream from platform blowback as he spends $20 million a year on his security.

The web is a mirror. Engagement-based algorithms reinforcing our perceptions & identities.

And every important story has at least 2 sides!

Some may "learn" vaccines don't work. Others may learn the vaccines their own children took did not work, as it failed to protect them from the antivax content spread by Facebook & Google, absorbed by people spreading measles & Medieval diseases.

Passion drives engagement, which drives algorithmic distribution: "There’s an asymmetry of passion at work. Which is to say, there’s very little counter-content to surface because it simply doesn’t occur to regular people (or, in this case, actual medical experts) that there’s a need to produce counter-content."

As the costs of "free" become harder to hide, social media companies which currently sell emerging markets as their next big growth area will end up having embedded regulatory compliance costs which will end up exceeding any sort of prospective revenue they could hope to generate.

The Pinterest S1 shows almost all their growth is in emerging markets, yet almost all their revenue is inside the United States.

As governments around the world see the real-world cost of the foreign tech companies & view some of them as piggy banks, eventually the likes of Facebook or Google will pull out of a variety of markets they no longer feel worth serving. It will be like Google did in mainland China with search after discovering pervasive hacking of activist Gmail accounts.

Lower friction & lower cost information markets will face more junk fees, hurdles & even some legitimate regulations. Information markets will start to behave more like physical goods markets.

The tech companies presume they will be able to use satellites, drones & balloons to beam in Internet while avoiding messy local issues tied to real world infrastructure, but when a local wealthy player is betting against them they'll probably end up losing those markets: "One of the biggest cheerleaders for the new rules was Reliance Jio, a fast-growing mobile phone company controlled by Mukesh Ambani, India’s richest industrialist. Mr. Ambani, an ally of Mr. Modi, has made no secret of his plans to turn Reliance Jio into an all-purpose information service that offers streaming video and music, messaging, money transfer, online shopping, and home broadband services."

Publishers do not have "their mojo back" because the tech companies have been so good to them, but rather because the tech companies have been so aggressive that they've earned so much blowback which will in turn lead publishers to opting out of future deals, which will eventually lead more people back to the trusted brands of yesterday.

Publishers feeling guilty about taking advertorial money from the tech companies to spread their propaganda will offset its publication with opinion pieces pointing in the other direction: "This is a lobbying campaign in which buying the good opinion of news brands is clearly important. If it was about reaching a target audience, there are plenty of metrics to suggest his words would reach further – at no cost – on Facebook. Similarly, Google is upping its presence in a less obvious manner via assorted media initiatives on both sides of the Atlantic. Its more direct approach to funding journalism seems to have the desired effect of making all media organisations (and indeed many academic institutions) touched by its money slightly less questioning and critical of its motives."

When Facebook goes down direct visits to leading news brand sites go up.

When Google penalizes a no-name me-too site almost nobody realizes it is missing. But if a big publisher opts out of the ecosystem people will notice.

The reliance on the tech platforms is largely a mirage. If enough key players were to opt out at the same time people would quickly reorient their information consumption habits.

If the platforms can change their focus overnight then why can't publishers band together & choose to dump them?

In Europe there is GDPR, which aimed to protect user privacy, but ultimately acted as a tax on innovation by local startups while being a subsidy to the big online ad networks. They also have Article 11 & Article 13, which passed in spite of Google's best efforts on the scaremongering anti-SERP tests, lobbying & propaganda fronts: "Google has sparked criticism by encouraging news publishers participating in its Digital News Initiative to lobby against proposed changes to EU copyright law at a time when the beleaguered sector is increasingly turning to the search giant for help."

Remember the Eric Schmidt comment about how brands are how you sort out (the non-YouTube portion of) the cesspool? As it turns out, he was allegedly wrong as Google claims they have been fighting for the little guy the whole time:

Article 11 could change that principle and require online services to strike commercial deals with publishers to show hyperlinks and short snippets of news. This means that search engines, news aggregators, apps, and platforms would have to put commercial licences in place, and make decisions about which content to include on the basis of those licensing agreements and which to leave out. Effectively, companies like Google will be put in the position of picking winners and losers. ... Why are large influential companies constraining how new and small publishers operate? ... The proposed rules will undoubtedly hurt diversity of voices, with large publishers setting business models for the whole industry. This will not benefit all equally. ... We believe the information we show should be based on quality, not on payment.

Facebook claims there is a local news problem: "Facebook Inc. has been looking to boost its local-news offerings since a 2017 survey showed most of its users were clamoring for more. It has run into a problem: There simply isn’t enough local news in vast swaths of the country. ... more than one in five newspapers have closed in the past decade and a half, leaving half the counties in the nation with just one newspaper, and 200 counties with no newspaper at all."

Google is so for the little guy that for their local news experiments they've partnered with a private equity backed newspaper roll up firm & another newspaper chain which did overpriced acquisitions & is trying to act like a PE firm (trying to not get eaten by the PE firm).

Does the above stock chart look in any way healthy?

Does it give off the scent of a firm that understood the impact of digital & rode it to new heights?

If you want good market-based outcomes, why not partner with journalists directly versus operating through PE chop shops?

If Patch is profitable & Google were a neutral ranking system based on quality, couldn't Google partner with journalists directly?

Throwing a few dollars at a PE firm in some nebulous partnership sure beats the sort of regulations coming out of the EU. And the EU's regulations (and prior link tax attempts) are in addition to the three multi billion Euro fines the European Union has levied against Alphabet for shopping search, Android & AdSense.

Google was also fined in Russia over Android bundling. The fine was tiny, but after consumers gained a search engine choice screen (much like Google pushed for in Europe on Microsoft years ago) Yandex's share of mobile search grew quickly.

The UK recently published a white paper on online harms. In some ways it is a regulation just like the tech companies might offer to participants in their ecosystems:

Companies will have to fulfil their new legal duties or face the consequences and “will still need to be compliant with the overarching duty of care even where a specific code does not exist, for example assessing and responding to the risk associated with emerging harms or technology”.

If web publishers should monitor inbound links to look for anything suspicious then the big platforms sure as hell have the resources & profit margins to monitor behavior on their own websites.

Australia passed the Sharing of Abhorrent Violent Material bill which requires platforms to expeditiously remove violent videos & notify the Australian police about them.

There are other layers of fracturing going on in the web as well.

Programmatic advertising shifted revenue from publishers to adtech companies & the largest ad sellers. Ad blockers further lower the ad revenues of many publishers. If you routinely use an ad blocker, try surfing the web for a while without one & you will notice layover welcome AdSense ads on sites as you browse the web - the very type of ad they were allegedly against when promoting AMP.

Tracking protection in browsers & ad blocking features built directly into browsers leave publishers more uncertain. And who even knows who visited an AMP page hosted on a third party server, particularly when things like GDPR are mixed in? Those who lack first party data may end up having to make large acquisitions to stay relevant.

Voice search & personal assistants are now ad channels.

App stores are removing VPNs in China, removing Tiktok in India, and keeping female tracking apps in Saudi Arabia. App stores are centralized chokepoints for governments. Every centralized service is at risk of censorship. Web browsers from key state-connected players can also censor messages spread by developers on platforms like GitHub.

Microsoft's newest Edge web browser is based on Chromium, the source of Google Chrome. While Mozilla Firefox gets most of their revenue from a search deal with Google, Google has still went out of its way to use its services to both promote Chrome with pop overs AND break in competing web browsers:

"All of this is stuff you're allowed to do to compete, of course. But we were still a search partner, so we'd say 'hey what gives?' And every time, they'd say, 'oops. That was accidental. We'll fix it in the next push in 2 weeks.' Over and over. Oops. Another accident. We'll fix it soon. We want the same things. We're on the same team. There were dozens of oopses. Hundreds maybe?" - former Firefox VP Jonathan Nightingale

As phone sales fall & app downloads stall a hardware company like Apple is pushing hard into services while quietly raking in utterly fantastic ad revenues from search & ads in their app store.

Part of the reason people are downloading fewer apps is so many apps require registration as soon as they are opened, or only let a user engage with them for seconds before pushing aggressive upsells. And then many apps which were formerly one-off purchases are becoming subscription plays. As traffic acquisition costs have jumped, many apps must engage in sleight of hand behaviors (free but not really, we are collecting data totally unrelated to the purpose of our app & oops we sold your data, etc.) in order to get the numbers to back out. This in turn causes app stores to slow down app reviews.

Apple acquired the news subscription service Texture & turned it into Apple News Plus. Not only is Apple keeping half the subscription revenues, but soon the service will only work for people using Apple devices, leaving nearly 100,000 other subscribers out in the cold: "if you’re part of the 30% who used Texture to get your favorite magazines digitally on Android or Windows devices, you will soon be out of luck. Only Apple iOS devices will be able to access the 300 magazines available from publishers. At the time of the sale in March 2018 to Apple, Texture had about 240,000 subscribers."

Apple is also going to spend over a half-billion Dollars exclusively licensing independently developed games:

Several people involved in the project’s development say Apple is spending several million dollars each on most of the more than 100 games that have been selected to launch on Arcade, with its total budget likely to exceed $500m. The games service is expected to launch later this year. ... Apple is offering developers an extra incentive if they agree for their game to only be available on Arcade, withholding their release on Google’s Play app store for Android smartphones or other subscription gaming bundles such as Microsoft’s Xbox game pass.

Verizon wants to launch a video game streaming service. It will probably be almost as successful as their Go90 OTT service was. Microsoft is pushing to make Xbox games work on Android devices. Amazon is developing a game streaming service to compliment Twitch.

The hosts on Twitch, some of whom sign up exclusively with the platform in order to gain access to its moneymaking tools, are rewarded for their ability to make a connection with viewers as much as they are for their gaming prowess. Viewers who pay $4.99 a month for a basic subscription — the money is split evenly between the streamers and Twitch — are looking for immediacy and intimacy. While some hosts at YouTube Gaming offer a similar experience, they have struggled to build audiences as large, and as dedicated, as those on Twitch. ... While YouTube has made millionaires out of the creators of popular videos through its advertising program, Twitch’s hosts make money primarily from subscribers and one-off donations or tips. YouTube Gaming has made it possible for viewers to support hosts this way, but paying audiences haven’t materialized at the scale they have on Twitch.

Google, having a bit of Twitch envy, is also launching a video game streaming service which will be deeply integrated into YouTube: "With Stadia, YouTube watchers can press “Play now” at the end of a video, and be brought into the game within 5 seconds. The service provides “instant access” via button or link, just like any other piece of content on the web."

Google will also launch their own game studio making exclusive games for their platform.

When consoles don't use discs or cartridges so they can sell a subscription access to their software library it is hard to be a game retailer! GameStop's stock has been performing like an ICO. And these sorts of announcements from the tech companies have been hitting stock prices for companies like Nintendo & Sony: “There is no doubt this service makes life even more difficult for established platforms,” Amir Anvarzadeh, a market strategist at Asymmetric Advisors Pte, said in a note to clients. “Google will help further fragment the gaming market which is already coming under pressure by big games which have adopted the mobile gaming business model of giving the titles away for free in hope of generating in-game content sales.”

The big tech companies which promoted everything in adjacent markets being free are now erecting paywalls for themselves, balkanizing the web by paying for exclusives to drive their bundled subscriptions.

How many paid movie streaming services will the web have by the end of next year? 20? 50? Does anybody know?

Disney alone with operate Disney+, ESPN+ as well as Hulu.

And then the tech companies are not only licensing exclusives to drive their subscription-based services, but we're going to see more exclusionary policies like YouTube not working on Amazon Echo, Netflix dumping support for Apple's Airplay, or Amazon refusing to sell devices like Chromecast or Apple TV.

The good news in a fractured web is a broader publishing industry that contains many micro markets will have many opportunities embedded in it. A Facebook pivot away from games toward news, or a pivot away from news toward video won't kill third party publishers who have a more diverse traffic profile and more direct revenues. And a regional law blocking porn or gambling websites might lead to an increase in demand for VPNs or free to play points-based games with paid upgrades. Even the rise of metered paywalls will lead to people using more web browsers & more VPNs. Each fracture (good or bad) will create more market edges & ultimately more opportunities. Chinese enforcement of their gambling laws created a real estate boom in Manila.

So long as there are 4 or 5 game stores, 4 or 5 movie streaming sites, etc. ... they have to compete on merit or use money to try to buy exclusives. Either way is better than the old monopoly strategy of take it or leave it ultimatums.

The publisher wins because there is a competitive bid. There won't be an arbitrary 30% tax on everything. So long as there is competition from the open web there will be means to bypass the junk fees & the most successful companies that do so might create their own stores with a lower rate: "Mr. Schachter estimates that Apple and Google could see a hit of about 14% to pretax earnings if they reduced their own app commissions to match Epic’s take."

As the big media companies & big tech companies race to create subscription products they'll spend many billions on exclusives. And they will be training consumers that there's nothing wrong with paying for content. This will eventually lead to hundreds of thousands or even millions of successful niche publications which have incentives better aligned than all the issues the ad supported web has faced.

Categories: 


source http://www.seobook.com/fractured

Three fundamental factors in the production of link-building content

One of the most overused phrases in content marketing is how it is an ever-changing landscape, forcing agencies and marketers to adapt and improve their existing processes.

In a short space of time, a topic can go from being newsworthy to negligible, all while certain types of content become tedious to the press and its readers.

A vast amount of the work we do — at Kaizen and many other similar agencies — is create content with the sole purpose of building high authority links, making it all the more imperative that we are conscious of the changes and trends outlined above.

If we were to split the creative process into three sections — content, design, and outreach strategy — how are we able to engineer our own successes and failures to provide us with a framework for future campaigns?

Three important factors for producing link-worthy content

Over the past month, I’ve analyzed over 120 pieces of content across 16 industries to locate and define the common threads between campaigns that exceed or fall short of their expectations. From the amount of data used and visualized to the importance of effective headline storytelling, the insight is a way of both rationalizing and reshaping our approach to content production.

1. Not too much data — our study showed an average of just over five metrics

Behind every great piece of content is (usually) a unique or noteworthy set of data. Both static and interactive content enables us to display limitless amounts of research which provide the origins of the stories we try to communicate. However many figures or metrics you choose to visualize, there is always a point where a journalist or reader switches off.

This glass ceiling is difficult to pinpoint and depends on the type of content, and the industry or readership you’re looking to appeal to, but a more granular study of good and poor performing campaigns that I performed suggested some benefits of refining data sets.

Observations

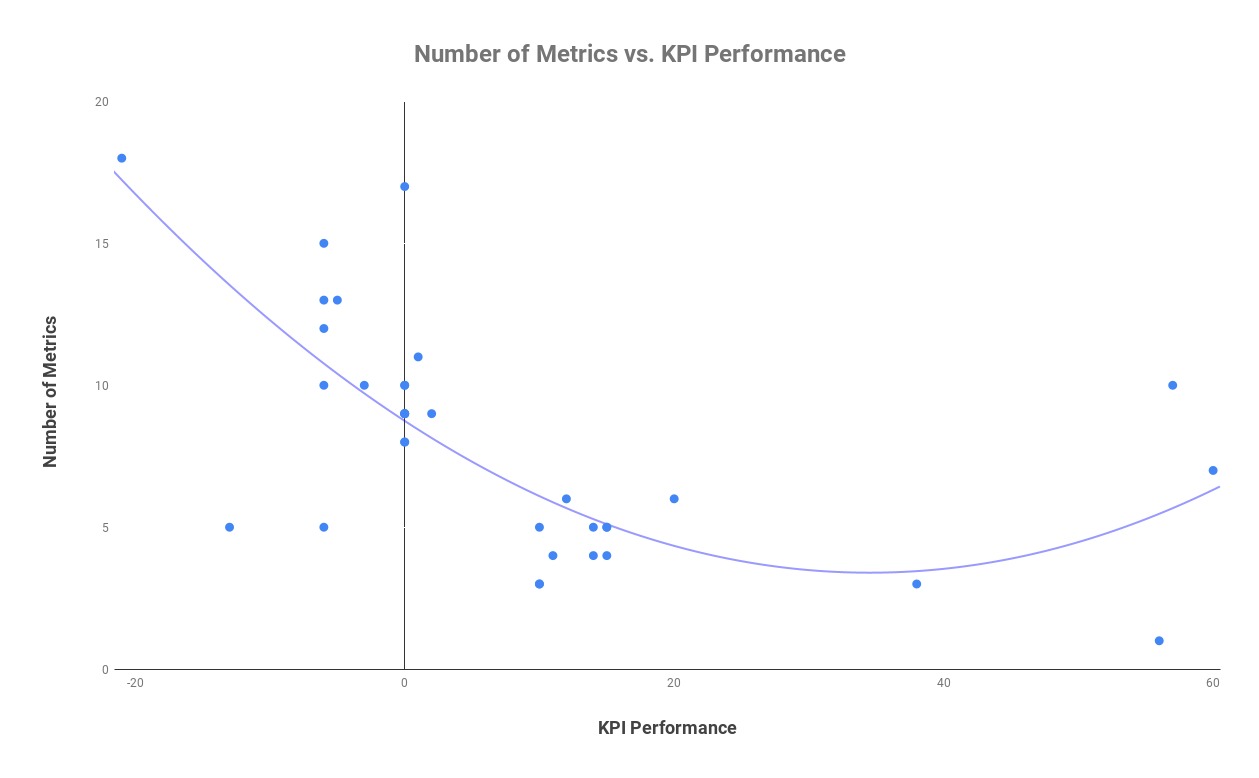
A starting point for any piece of research is the individual metrics, whether it is cost, type, or essentially anything worth measuring and comparing. In my research, in the content campaigns that exceed our typical KPI, there was an average of just over 5 metrics used on each piece compared to almost double in campaigns with either a normal or below satisfactory performance. The graph below shows the correlation between a lower number of metrics and a higher link performance.

Graph of various metrics and high link performance

An example of these findings in practice can be found in an infographic study completed for online travel retailer Lastminute.com that sought to find the world’s most chilled out countries. Following a comprehensive study of 36 countries across 10 metrics, the task was to refine these figures in a way that can be translated well through its design. The number of countries was whittled down to just the top 15, and the metrics were condensed to have four indexes which the rankings were based on. The decision to not showcase the data in its entirety proved fruitful, securing over 50 links, covered by the Mail Online and Lonely Planet.

As an individual who very much enjoys partaking in the research process, it can be extremely difficult to sacrifice any element of your work, but it is that level of tact in the production of content that distinguishes one piece from another.

2. Simple, powerful data visualizations — our analysis showed highest achievers had just one visualization

Regardless of how saturated the content marketing industry becomes, we are graced every year with new and innovative ways of visualizing data. The balancing act between originality in your design and an unnecessarily complex data-visualization is often the point on which success and failure can pivot. As is the case with data, overloading a piece of content with an amass of multi-faceted graphs and charts is a surefire way of alienating your users, leaving them either bored or confused.

Observations

For my study, I decided to look at the content that contained data visualizations that failed to hit the mark and see whether the quality is as much of a problem as quantity in terms of design. As I carried out the analysis, I denoted the two examples where one visual would incorporate most or all of the study, or the same illustration was replicated several times for a country, region or sector. For instance, this study, from medical travel insurance provider Get Going, on reliable airlines condenses all the key information into one single data-visualization. Conversely, this piece from The Guardian on the gender pay gap shows how it can be effective to use one visual several times to present your data.     

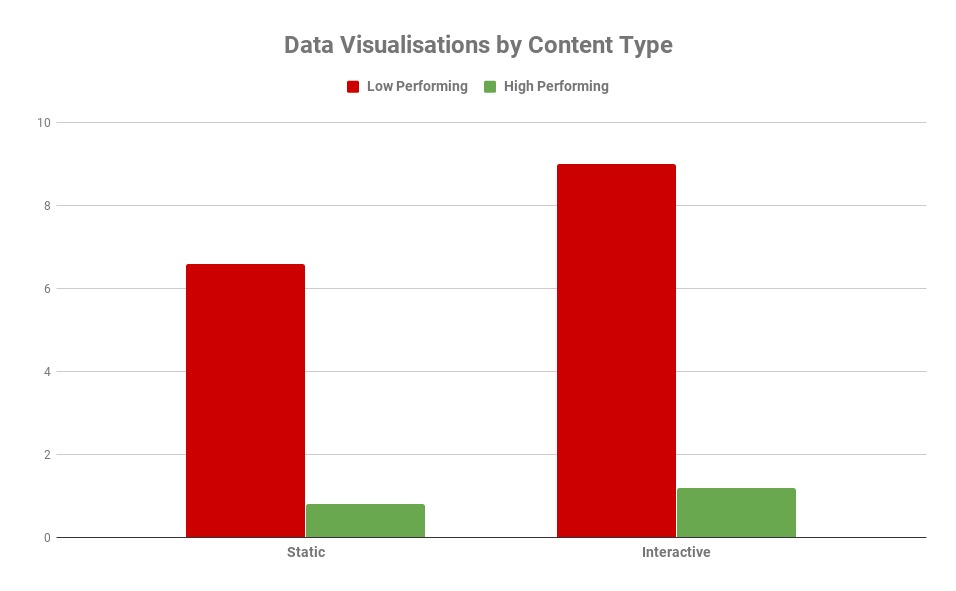
Unsurprisingly, many of the low scorers in my research averaged around eight different forms of data visualizations while high achievers contained just one. The graph below showcases how many data-visualizations are used on average by high and low performing pieces, both static and interactive. Low performing static examples contained an average of just over six, with less than one for their higher-scoring counterparts. For interactive content, the optimum is just over one with poor performing content containing almost nine per piece.

Graph on analyzing the performance of static and interactive content types

In examples where the same type of graph or chart was used repeatedly, poor performers had approximately 33 per piece, with their more favorable counterparts using just three.

It is important to note that ranking-based pieces often require the repetition of a visual in order to tell a story, but once again this is part of the balancing act for creatives in terms of what type and how many data-visualizations one utilizes.

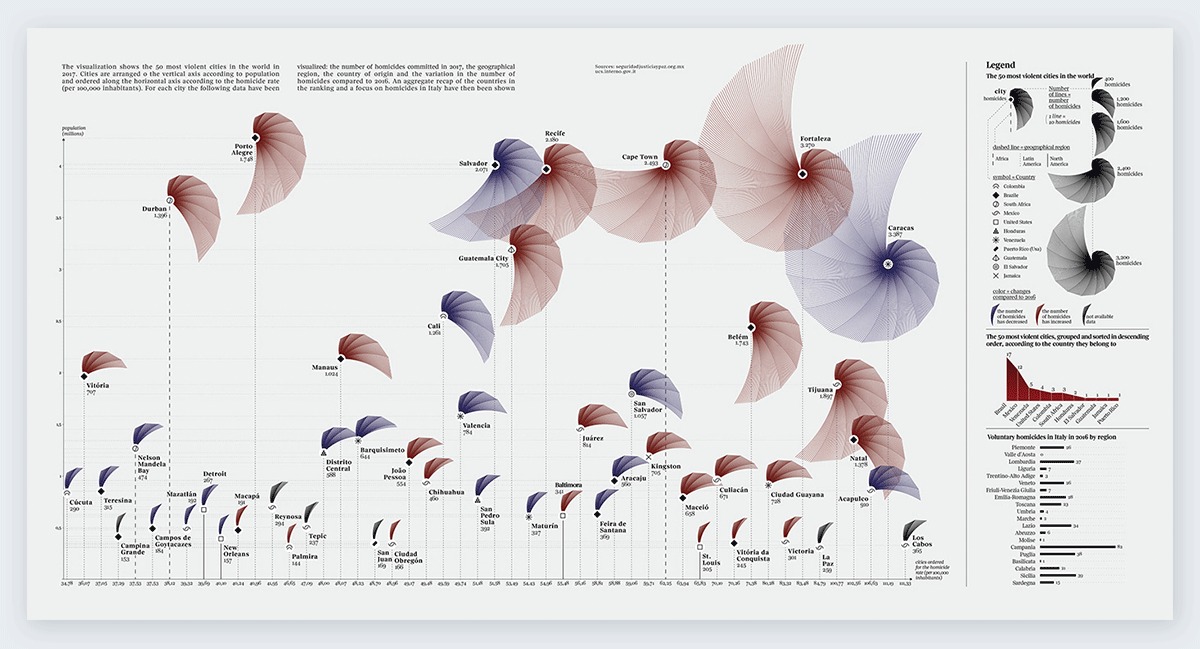
A fine example of an effective illustration of the data study contained in one visual comes from a 2017 piece by Federica Fragapane for Italian publication La Lettura, showcasing the most violent cities in the world. The chart depicts each city as a shape sized by its homicide rate, with other small indicators defined in the legend to the right of the graphic. The aesthetic qualities of the graph give a campaign, fairly morbid in the topic, an extended appeal beyond the subject of just global crime. While the term “design-led” is so-often thrown around, this example proves how effective it can be to integrate visuals effectively through your data. The piece, produced originally for print, proved hugely successful in the design space, with 18 referring domains from sites such as Visme.co.

An example graph of integrating visuals effectively through data

3. Pandering to the press — over a third of our published links used the same headline as our pitch email subject line

Kaizen produces hundreds of campaigns on a yearly basis across a range of industries, meaning the task of looking inward is as necessary today as it ever has been. Competition means that press contacts are looking for something extra special to warrant your content’s publication. While ingenuity is required in every area of content marketing, it’s equally important to recognize the importance of getting the basics right.

The task of outreach can be won and lost in several ways, but your subject line is, and will always be, the most significant component of your pitch. Whether you encapsulate your content in a single sentence or highlight your most attention-worthy finding, an email headline is a laborious but crucial task. My task through my research was to find how vital it is in terms of the end result of achieving coverage.

Observations

As part of my analysis, I recorded the backlinks of a sample of our high and average content and recorded the headlines used in the coverage for each campaign. I found in better-performing examples, over a third of links used the same headlines used in our pitch emails, emphasizing the importance of effective storytelling in every area of your PR process. Below is an illustration in the SERPs of how far an effective headline can take you, with example coverage from one of our most successful pieces for TotallyMoney on work/life balance in Europe.

Example of effective headlines for high-link performance

Another area I was keen to investigate, given the time and effort that goes into it, is how press releases are used across the coverage we get. Using scraping software, I was able to pull out the copy from each article where a follow link was achieved and compare it to the press releases we have produced. It was pleasing to see that one in five links contained at least a paragraph of copy used in our press materials. In contrast, just seven percent of the coverage within the lower performing campaigns contained a reference to our press releases, and an even lower four percent using headlines from our email subject lines.

Final thoughts

These correlations, similar to the ones discussed previously, suggest not only how vital the execution of basic processes are, but serve as a reminder that a campaign can do well or fall down at so many different points of production. For marketers, analysis of this nature indicates that a refinement of creative operations is a more secure route for your content and its coverage. Don’t think of it as “less is more” but a case of picking the right tools for the job at hand.

Nathan Abbott is Content Manager at Kaizen.

The post Three fundamental factors in the production of link-building content appeared first on Search Engine Watch.


source https://searchenginewatch.com/2019/04/15/three-fundamental-factors-in-the-production-of-link-building-content/

Tuesday, 16 April 2019

Top 19 Instagram marketing tools to use for success

Instagram is a phenomenon of our time. The photo-sharing app has 7.7 billion users by now (and counting).

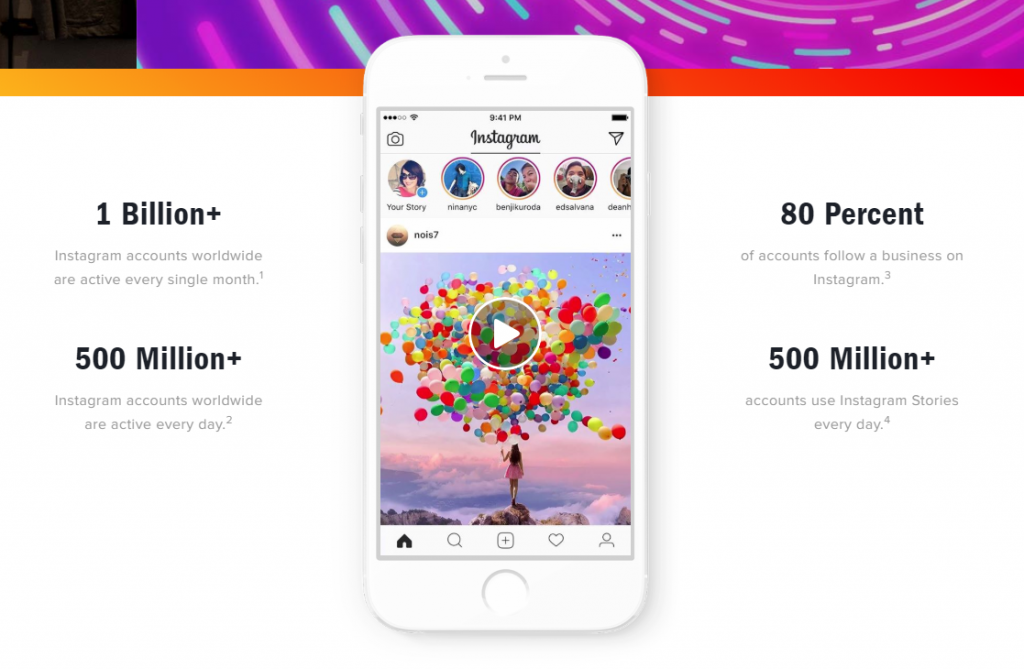
One billion people use Instagram every month and 500 million use the platform every day. Its engagement is also 10 times higher than that of Facebook, 54 times higher than Pinterest’s, and 84 times higher than Twitter’s.

All kinds of businesses ranging from your teen neighbor making earrings to huge corporations and media are on Instagram. And for a good reason — 80% of Instagram accounts follow at least one business.

Instagram business statistics

[Screenshot taken from the Instagram Business homepage]

At times when Facebook is becoming more and more Messenger-based and Twitter revolves around politics and social issues, Instagram stands to be the platform for friends, strangers, and brands alike.

It’s no surprise we’re so serious about Instagram marketing and the tools that help us with it.

Below is the list of such tools which covers everything from filters to analytics.

19 top Instagram marketing tools

1. Grum

Grum is a scheduling tool that lets you publish content (both photos and videos) on Instagram. You can publish from multiple accounts at the same time and tag the users. You can do that right from your desktop.

Price: Starts at $9.9/month. Offers a free trial for 3 days.

2. Awario

Awario is a social media monitoring tool that finds mentions of your brand (or any other keyword) across the web, news/blogs, and social media platforms, including Instagram. By analyzing mentions of your brand on the platform, it tells you who your brand advocates and who the industry influencers are, what the sentiment behind your brand (positive, negative, or neutral) is, as well as the languages and locations of your audience. It also analyzes the growth and reach of your mentions, and tells you how you compare to your competitors.

Price: Starts at $29/month. Offers a free trial for 14 days.

3. Buffer

Buffer is another scheduling tool. However, it includes Instagram among other social networks rather than focusing on Instagram alone. With Buffer, you can schedule content to be published across Instagram, Facebook, Twitter, Pinterest, and LinkedIn. You can publish the same or different messages across different platforms. You can also review how your posts are performing in terms of engagement, impressions, and clicks.

The tool can be used by up to 25 team members, and you can assign them the appropriate access levels.

Price: Starts at $15/month. Offers free 7-day or 14-day trials depending on the plan.

4. Hashtags for likes

Hashtags for likes is a simple tool that suggests you the most trending relevant hashtags. Knowing the most popular hashtags in real time helps brands keep up with trends, bandwagon on the news, and ultimately grow followers.

Price: $9.99/month.

5. Iconosquare

Iconosquare is a social media analytics tool that works for Instagram and Facebook. It shows you the metrics on content performance and engagement as well as on your followers. You’ll discover the best times to post and understand your followers better. The tool also analyzes Instagram Stories.

Besides analytics, you can schedule posts, monitor tags and comments about your brand.

Price: Starts at $39/month. A free 14-day trial is available.

6. Canva

Canva is a design tool that is a great fit for marketers and companies that don’t have an in-house designer. Among other things, Canva helps create perfect Instagram stories. Stylish templates and easy design tools ensure that your Story stands out, which, again, isn’t easy in the world of Instagram.

Price: Free

7. Shortstack

Shortstack is a tool to run Instagram contests. Contests are huge on this platform, they cause loads of buzz, increase brand awareness, and attract new followers. They are a practice loved by marketers.

ShortStack gathers all user-generated content, such as images that have been posted on your content hashtag, and displays them. It also keeps track of your campaign’s performance, showing your traffic, engagement, and other valuable data.

Price: Free up to 100 entries. Paid plans start at $29/month.

8. Soldsie

Soldsie is a handy tool that helps you to sell on Instagram and Facebook using comments. All you have to do is upload a product picture with relevant product information. Users who are registered with Soldsie can simply comment on the photo, and Soldsie will turn that into a transaction.

More expensive Soldsie plans are also integrated with Shopify.

Price: Starts at $49/monthly and 5.9% transaction fee.

9. Social Rank

Social Rank is a tool that identifies and analyzes your audience. You can identify influencers among your followers, see who engages with your brand and with what frequency. You can sort your followers in lists that are easy to work with (for example: most valuable, most engaged, and others).

You can also filter your audience by bio keyword, word/hashtag, and geographic location.

Price: Available on request.

10. Plann

Plann is an Instagram social media management tool. It allows you to design, edit, schedule, and analyze your posts. For example, you can edit the Instagram grid to look just as you wish. You can rearrange, organize, crop, and schedule your Instagram Stories. All exciting stats, from best times to post and best-performing hashtags to your best-performing color schemes are available. And you can also collaborate with other marketers to run your Instagram account together.

Price: Free, paid plans start from $6/month.

11. Social Insights

Social Insights is another platform that offers many important Instagram marketing features, such as scheduling and posting from your computer, identifying and organizing your followers, and analyzing followers’ growth, interactions, and engagement. You can add other team members without sharing your Instagram login.

Price: Starts at $29/month. A free 14-day trial is available.

12. Instagram Ads by Mailchimp

If you’re already using MailChimp, its Instagram Ads feature might come in handy. The tool lets you use MailChimp contact lists to create Instagram campaigns. The whole process (creating, buying, and tracking results of your ads) is, therefore, in the familiar place and powered by data.

Price: No extra fees if you’re using MailChimp.

13. Unfold – Story Creator

Unfold – Story Creator is an iOS app that makes lifestyle, fashion, and travel content more professional-looking. The app offers stylish templates, advanced fonts and text tools, and exports your stories in high resolution so that you can share them to other platforms besides Instagram.

Price: Free

14. Picodash

Picodash is an Instagram tool that finds target audiences and influencers on the platform. It lets you export your and your competitors’ Instagram followers and following lists, users that have used a specific hashtag, posted at a specific location or venue, commented or liked a specific post, as well as tagged users. You can also download any account stories or highlighted stories.

Price: Starts from $10 for a Followers/Hashtag Posts export. You can also request a sample of 100 for free before you order a full export report.

15. Wyng

Wyng is an enterprise-level platform that finds user-generated content with a specific mention or hashtag, exports it, and gets the rights to this content. This is very helpful for running contests. Instagram is, however, a tiny fraction of what the tool covers.

Price: Available on request. A free 14-day trial is available.

16. Afterlight

Afterlight is the iOS/Android image editing app that makes your content look more professional and refined. It offers plenty of unique filters, natural effects, and frames.

Price: $2.99

17. Sendible

Sendible is a popular social media management platform that lets you run accounts on different social media platforms, including Instagram. It’s integrated with some other tools that are useful for Instagram, such as Canva. The tool does scheduling, monitors mentions, and tracks the performance of your Instagram posts. You can also team up with other marketers and work together on your Instagram marketing (and other) goals.

Price: Starts at $29/month. A free 14-day trial is available.

18. Olapic

Olapic is an advanced visual commerce platform. It collects user-generated video content in real time, publishes it to your social media channels (including Instagram) makes it shoppable, measures and predicts which content will perform best. It goes far beyond Instagram and even social media. What is more, it obtains rights for the content for you so that you’re able to use it across your advertising, email, and offline channels.

Price: Available on request.

19. Pablo

Pablo (made by Buffer) is a platform that lets you easily create beautiful images for your Instagram marketing purposes. You can choose photos from Pablo’s own library which includes more than 500,000 images, add text (25+ stylish fonts are available) and format. The resizing option for various social platforms, including Instagram, will ensure your image fits perfectly.

Price: Free

Conclusion

As you can see, there’re plenty of tools to choose from. Check them out, spot the ones that you need, and take your Instagram marketing to a whole new level.

Aleh is the Founder and CMO at SEO PowerSuite and Awario. He can be found on Twitter at @ab80.

Read next:

The post Top 19 Instagram marketing tools to use for success appeared first on Search Engine Watch.


source https://searchenginewatch.com/2019/04/15/top-nineteen-instagram-marketing-tools-to-use-for-success/

How to optimize paid search ads for phone calls

There have been an abundance of hand-wringing articles published that wonder if the era of the phone call is over, not to mention speculation that millennials would give up the option to make a phone call altogether if it meant unlimited data.

But actually, the rise of direct dialing through voice assistants and click to call buttons for mobile search means that calls are now totally intertwined with online activity.

Calling versus buying online is no longer an either/or proposition. When it comes to complicated purchases like insurance, healthcare, and mortgages, the need for human help is even more pronounced. Over half of consumers prefer to talk to an agent on the phone in these high-stakes situations.

In fact, 70% of consumers have used a click to call button. And three times as many people prefer speaking with a live human over a tedious web form. And calls aren’t just great for consumers either. A recent study by Invoca found that calls actually convert at ten times the rate of clicks.

However, if you’re finding that your business line isn’t ringing quite as often as you’d like it to, here are some surefire ways to optimize your search ads to drive more high-value phone calls.  

Content produced in collaboration with Invoca.

Four ways to optimize your paid search ads for more phone calls

  1. Let your audience know you’re ready to take their call — and that a real person will answer

If you’re waiting for the phone to ring, make sure your audiences know that you’re ready to take their call. In the days of landlines, if customers wanted a service, they simply took out the yellow pages and thumbed through the business listings until they found the service they were looking for. These days, your audience is much more likely to find you online, either through search engines or social media. But that doesn’t mean they aren’t looking for a human to answer their questions.

If you’re hoping to drive more calls, make sure your ads are getting that idea across clearly and directly. For example, if your business offers free estimates, make sure that message is prominent in the ad with impossible-to-miss text reading, “For a free estimate, call now,” with easy access to your number.

And to make sure customers stay on the line, let them know their call will be answered by a human rather than a robot reciting an endless list of options.

  1. Cater to the more than half of users that will likely be on mobile

If your customer found your landing page via search, there’s a majority percent chance they’re on a mobile device.

While mobile accounted for just 27% of organic search engine visits in Q3 of 2013, its share increased to 57% as of Q4 2018.

Statistic: Mobile share of organic search engine visits in the United States from 3rd quarter 2013 to 4th quarter 2018 | Statista

That’s great news for businesses looking to boost calls, since mobile users obviously already have their phone in hand. However, forcing users to dig up a pen in order to write down your business number only to put it back into their phone adds an unnecessary extra step that could make some users think twice about calling.  

Instead, make sure mobile landing pages offer a click to call button that lists your number in big, bold text. Usually, the best place for a click to call button is in the header of the page, near your form, but it’s best practice to A/B test button location and page layouts a few different ways in order to make sure your click to call button can’t be overlooked.

  1. Use location-specific targeting

Since 2014, local search queries from mobile have skyrocketed in volume as compared to desktop.

Statistic: Local search query volume in the United States from 2014 to 2019, by platform (in billions) | Statista

In 2014, there were 66.5 billion search queries from mobile and 65.6 billion search queries from desktop.

Now in 2019, desktop has decreased slightly to 62.3 billion — while mobile has shot up to 141.9 billion — nearly a 250% increase in five years.

Mobile search is by nature local, and vice versa. If your customer is searching for businesses hoping to make a call and speak to a representative, chances are, they need some sort of local services. For example, if your car breaks down, you’ll probably search for local auto shops, click a few ads, and make a couple of calls. It would be incredibly frustrating if each of those calls ended up being to a business in another state.

Targeting your audience by region can ensure that you offer customers the most relevant information possible.

If your business only serves customers in Kansas, you definitely don’t want to waste perfectly good ad spend drumming up calls from California.

If you’re using Google Ads, make sure you set the location you want to target. That way, you can then modify your bids to make sure your call-focused ads appear in those regions.  

  1. Track calls made from ads and landing pages

Keeping up with where your calls are coming from in the physical world is important, but tracking where they’re coming from on the web is just as critical. Understanding which of your calls are coming from ads as well as which are coming from landing pages is an important part of optimizing paid search. Using a call tracking and analytics solution alongside Google Ads can help give a more complete picture of your call data.

And the more information you can track, the better. At a minimum, you should make sure your analytics solution captures data around the keyword, campaign/ad group, and the landing page that led to the call. But solutions like Invoca also allow you to capture demographic details, previous engagement history, and the call outcome to offer a total picture of not just your audience, but your ad performance.

For more information on how to use paid search to drive calls, check out Invoca’s white paper, “11 Paid Search Tactics That Drive Quality Inbound Calls.”

The post How to optimize paid search ads for phone calls appeared first on Search Engine Watch.


source https://searchenginewatch.com/2019/04/16/optimize-paid-search-phone-calls/

Monday, 15 April 2019

How to conduct a branded search audit

Search queries for your brand name, called “brand searches,” are among the most important keywords in a keyword portfolio. Even so, marketers are not often paying as much attention to these types of queries as they should.

While juicy high-volume non-branded queries are exciting, providing your audience and customers with helpful brand information it is an equally thrilling prospect. The truth is that users for many brands, big and small, are commonly underserved by branded search results they find.

In this post, we’ll show you exactly how to conduct a branded search audit, identify failing results, and implement improvements. This audit is one that we perform for our clients at Stella Rising. Now you can do the same for your clients or website.

The first part of the audit is about setting the stage. Do you know what ratio of your traffic is the result of non-brand queries vs. brand queries? You should. In this section of the audit, you’ll set the stage to discuss the importance of what you identify.

Why are branded queries so important?

Branded queries are among the most important keywords you can optimize as they represent a brand-aware audience that is more likely to convert. In fact, many of the people searching for your brand are already customers looking for information or looking to purchase again.

It’s easy (generally)

Unlike most things in SEO, Google wants you to rank well for your own brand terms. Whenever we see branded searches that are failing users, it’s usually easy to fix. Often, it’s as simple as creating a new page or changing a meta tag. Other times it can be more challenging, such as when brands have significant PR and/or brand reputation issues. That said, in most cases, branded search queries are among the easiest to rank for. Don’t overlook them.

Correlation to rankings and personalization

While the search volume of a domain name is not a confirmed ranking factor, Google does hold a patent that may indicate the more searches a brand receives, the more likely that brand is to to be seen as high quality by Google. This, in turn, may help them to rank for associated non-brand terms. What does that mean? Essentially, if tens of thousands of people search your brand name + couch, you may be more likely to rank for “sofas.” A number of 2014 Wayfair commercials brilliantly capitalized on this opportunity. The commercials literally told people to Google “Wayfair my sofa” or “Wayfair my kitchen,” thus tying signals around their entity to other non-brand entities.

How Wayfair brilliantly linked its advertising with its branded search terms

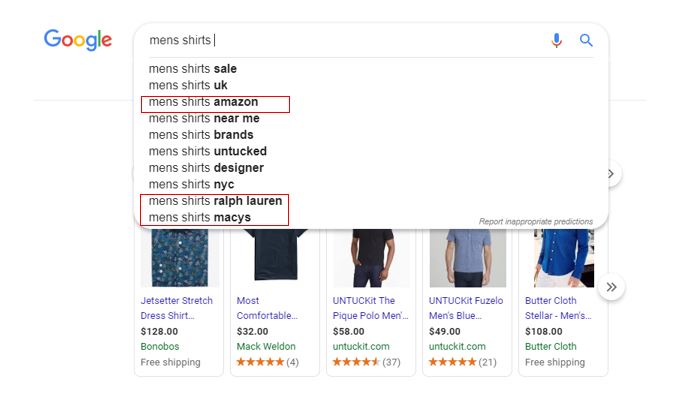
Branded searches can also impact autocomplete which in turn can impact more branded searches, feeding into the connection described above. When users click one of these autocompleted search suggestions, they execute a “branded search,” which then signals to Google that the entities are related. For example, “Amazon, Ralph Lauren or Macy’s” with “Men’s shirts”.

Branded search audit part one: Setting the stage

In part one of this audit, you will provide branded search landscape insights. Like any good show, you need to set the stage for the information you are about to present. This will help to win buy-in, prioritize your efforts, and keep you strategically on track.

What is your ratio of branded search?

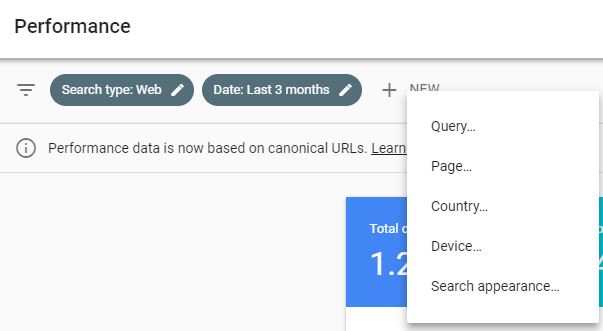
For this part, you’ll need to head to the Google Search Console and open up your performance report for the last three months. Start by setting up a filter for your brand name. If you have a brand name that people commonly misspell, then you will want to take that into account.*

Click the “+ New” button and then click “Query.” Filter by “Queries Containing” and not “Query is Exactly.”

Finding out the ratio of brand searches in Google Search Console

*Advanced Tip: The above instructions only account for your brand name, not product names that are proprietary to your brand. Consider using the API to pull down your GSC report and do filtering for those as well.

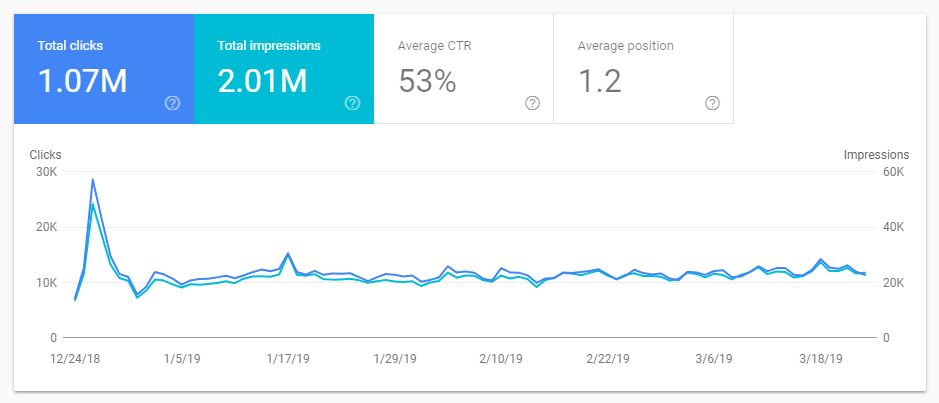
You’ll then see the total number of branded clicks and impressions your site receives.

Snapshot of total number of branded clicks and impressions

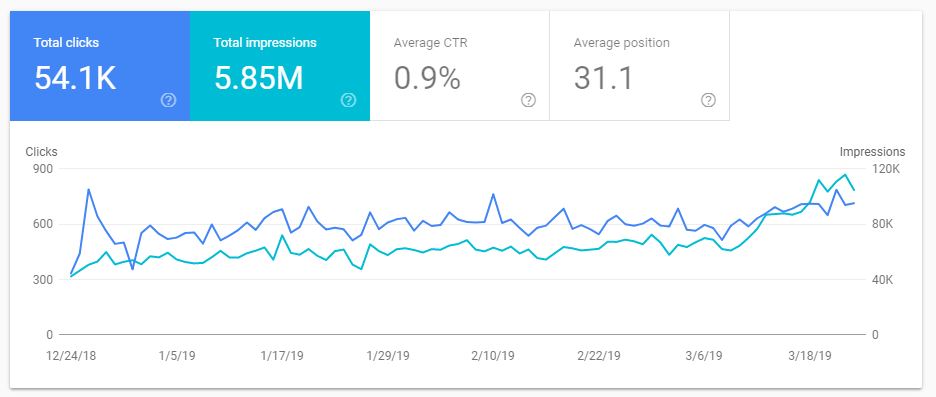
Now change your filter to “Queries not containing,” this will give you roughly the number of non-branded clicks the website has received from Google search.

Snapshot of non-branded clicks for a website

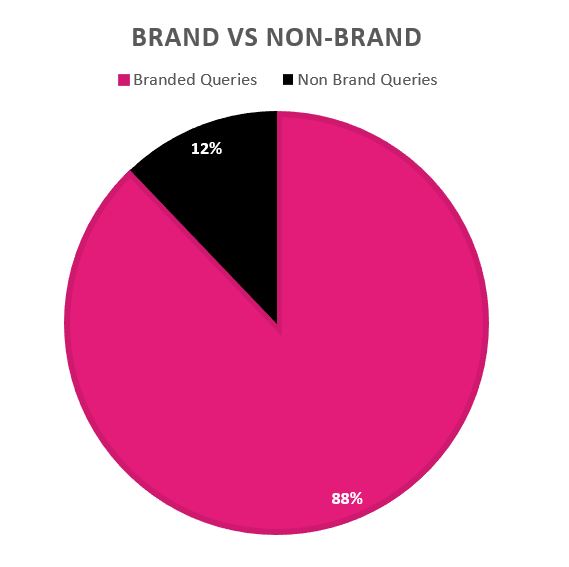
Take this data and bring it into Excel. From there, create a pie chart to visually demonstrate the ratio of branded to non-branded clicks the website receives.

Graph of branded search terms vs. non-branded search terms

What are the top branded queries driving traffic?

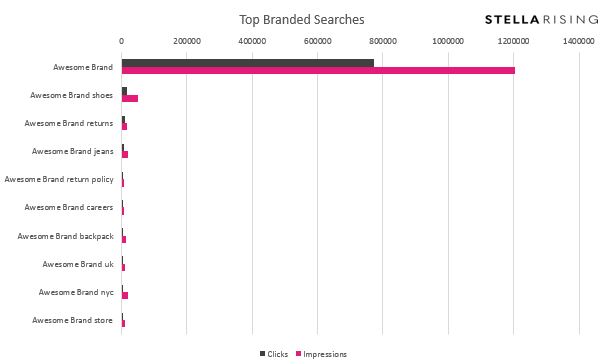
The next and perhaps one of the most critical questions for this analysis is, “What are the top branded queries?” Understanding this is important because the next step in this audit is to manually search each of the top ten (or more) queries. Then you will understand which queries will better serve users.

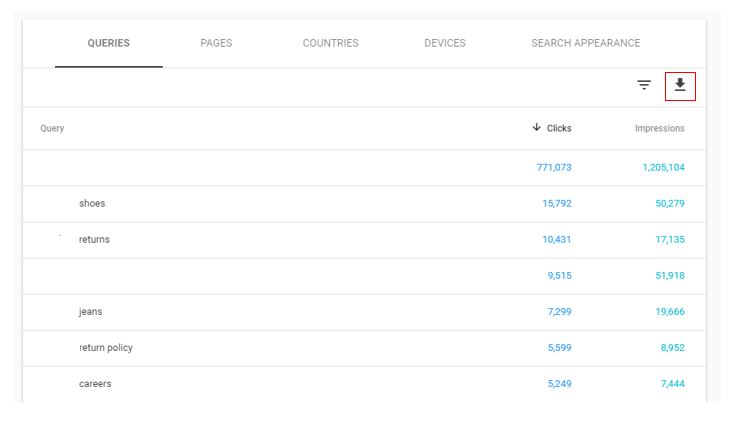
While this analysis is simple, we found that creating a simple visual with the data makes for a better story in your presentation. To do this, download the data by clicking the down arrow at the top of the queries table.

Example of using of Google Search Console to find search terms that serve users better

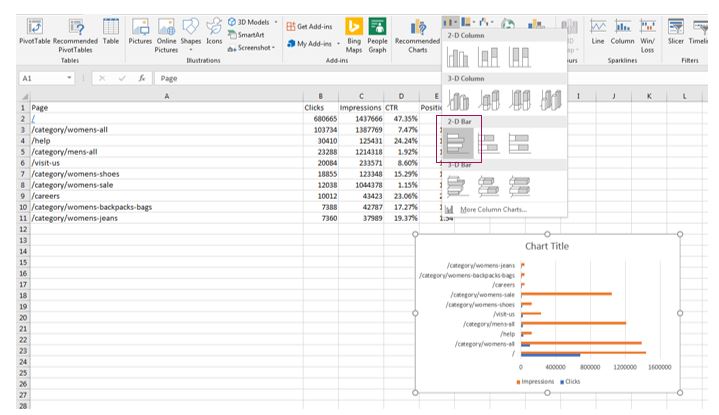
Once you have the data in Excel, you can create a cool visual using the 2D bar chart graph.

Example of creating 2D bar graphs in Excel to derive useful search queries

What are the top pages receiving branded clicks?

Similar to the above analysis, you will need to download the top pages from the “pages” tab in your performance report.

Analyzing top pages

Where do branded searches come from?

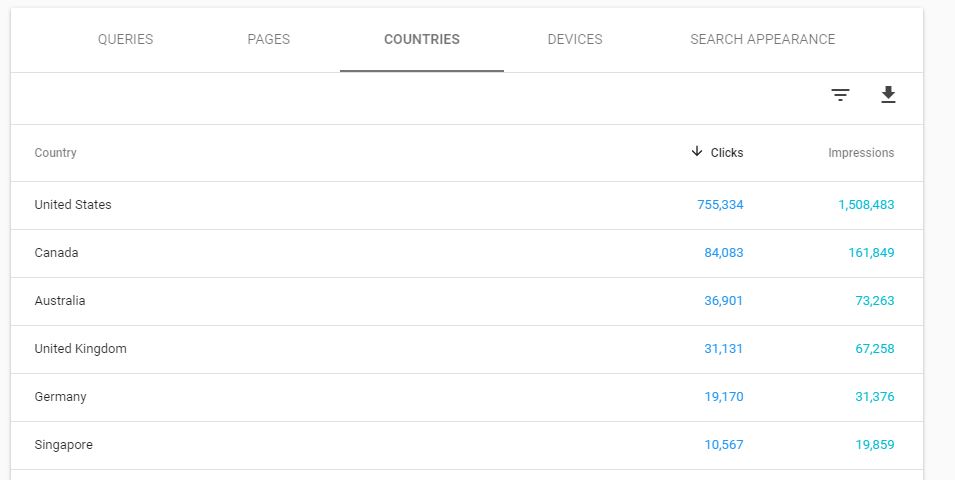
For some brands, it is worth considering where branded searches come from geographically. To find this information, set your filter to include brand queries and then click the “countries” tab in the Google Search Console.

Example of filtering brand search queries in Google Search Console

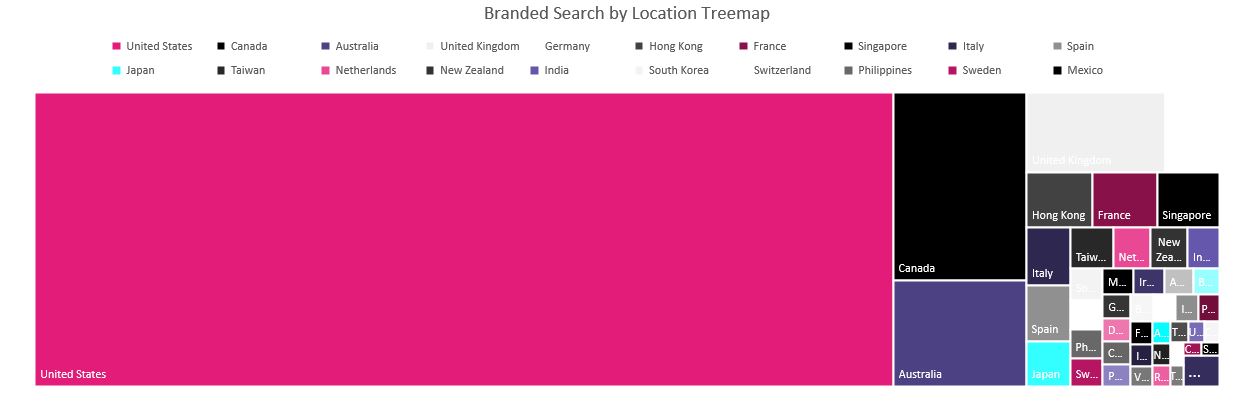
Now we could just put that image into a report, but what fun would that be? Instead, download the data and bring it into Excel to create a visual.

You can do this a number of ways, but we recommend either using a map or a tree-map which generates a cool way of looking at the data. A pie chart would do but is not as visually appealing. Open Excel and highlight the data you downloaded. Click “Insert”, then click either on “Maps” or the second box for a treemap.

Path for creating visually appealing graphs in Excel

Snapshot of results showing maximum branded search terms on basis of geography

Tree-map visualization of country click data

Tree-map visualization of country click data

How has branded search trended over time?

The last and perhaps the most essential question outside of which queries get clicks is, “how has branded search trended over time?” This trend is a hugely important question for any brand that has or is currently investing in brand building efforts, media, PR, or even non-branded paid search campaigns.

During this section of the audit, we have seen brands that previously invested millions in traditional print flatten out for years. Alternatively, we’ve also seen DTC brand’s growth hit a wall. Knowing where brand interest stands is a data point that is vital to all brands and their performance marketing strategies. Whether you are conducting a branded search audit or not, tracking the branded search volume is something that should be on the KPI list for marketers across a multitude of disciplines.

Branded search audit part two: Identifying issues in branded search

Do you have any brand image issues?

Sorry, no SEO magic here. If your brand, founder or employee made headlines (and not the good ones you send to mom) your only strategy is to do your best to rectify the situation.

Take, for example, a brand we came across which was at one point dealing with first page Google results full of nasty headlines. The headings covered how the center had allegedly abandoned more than 40 research animals on an island.

When I first heard this story and considered the best plan forward I thought, “Can they just decide not to abandon the animals and find them homes?”

In fact, that’s exactly what they did. As a result, the negative stories were replaced over time with positive ones about how the center reached an agreement to find a sanctuary for the animals. The first page of results for their brand name is now squeaky clean. The moral of this story is, never abandon animals on an island.

But, if you do, and get dragged through the mud for it, no amount of SEO will save you. Are there any abandoned research animals in your organization? If so, get them off the island.

In other less metaphorical terms, part of auditing brand search is brand reputation.

As we all now know, “E-A-T” and reputation are hugely important to Google. Deal with business practice issues head-on and find the best resolution possible. John Mueller has reminded us that Google has a really good memory and is not apt to forget anything about your brand history. Stains on your brand reputation can really take a toll and have lasting power. The best offense here is a good defense.

Searching the top ten queries

Now for the part of the audit where we find the broken stuff.

Take your list of top terms and manually execute the search in a private browsing window for each term. Record your results and a screenshot of the SERP.

What are we looking for?

  • The number of positions on the page we own – With branded searches for things like “brand name backpacks,” you can own 15+ of the top positions.
  • Others owning our conversation – Look for other brands ranking for your branded terms. Are they authorized to sell or talk about your products? Is the information they provide correct or accurate? Could a better job be done?
  • Misalignment of the query and title/meta – Does your title tag and meta description clearly speak to the query searched and align to the searcher’s intent? If not, make some changes to bring this into alignment. For example, if your shipping info is on a page labeled “FAQ” that’s unclear for users.
  • Cross-channel insights – Are all of your social properties listed on the first page where appropriate? Are others bidding on brand terms where you are not? Look for cross-channel synergies that could be leveraged for more aggregate traffic.
  • Broken pages – For big and small brands we have found soft “404” messages, outdated or broken pages ranking for highly searched branded terms. Click around the top ten and make sure everything is working as expected.
  • Out of stock products – Sometimes the products that rank for branded searches on ecommerce sites are out of stock. Make sure you have a protocol in place for managing inventory so that searchers are best served by the landing page.

Searching other navigational queries

Other areas to check out are navigational or known brand queries that help users navigate and interact with your brand. For example:

  • Brand Name Opening Hours
  • Brand Name Location
  • Brand Name Address
  • Brand Name Telephone Number
  • Brand Name Customer Service
  • Brand Name FAQ
  • Brand Name Return Policy
  • Brand Name Shipping
  • Brand Name Refund Policy
  • Brand Name Size Chart/Guide
  • Brand Name Sale

Manually execute a search in a private browsing window for these terms. You’re looking for title tags and meta descriptions that do not speak to the query, missing pages where content would be better-served broken-out, and other websites owing the conversation around your terms. In some of our audits, we have seen third-party sellers ranking on position one for things like “brand name return policy”.

Furthermore, the information presented was not even correct. When it came to our site, we were not making that information easy to find, and as such, we got beat out. Simple adjustments to meta information and where content lived helped to improve our visibility and win back the featured snippet.

Track and measure

As with any good SEO effort, you should carefully track and measure the success of your recommendations. Consider setting up a monthly tracking sheet for your branded search volume. Also, consider tracking some of the branded queries identified as “needing work” in your rank tracker.

Conclusion

The branded search audit is a deliverable which does not take a great deal of time but can result in tremendous impact for your brand or client. By focusing on branded queries first, you are serving those most likely to convert on your site while simultaneously addressing your lowest hanging fruit.

Have questions about conducting your own audit? Let us know in the comments section below.

John Morabito is the Director of SEO at Women’s Marketing / Flying Point Digital. He can be found on Twitter @JohnMorabitoSEO.

The post How to conduct a branded search audit appeared first on Search Engine Watch.


source https://searchenginewatch.com/2019/04/15/how-to-branded-search-audit/